Mehl ist mehr als nur Wasser und Getreide

Der folgende Artikel wurde ursprünglich in einer Ausgabe von Baking+Biscuit International veröffentlicht. Folgen Sie diesem Link, um das Interview auf der Website der Publikation anzusehen.
After wheat is milled into flour, its performance is the main priority. With the introduction of roller mills over 100 years ago and the steady disappearance of stone mills, not only did flour stability improve, but millers found themselves in a much better position to control flour consistency and differentiate their products from competitors. The introduction of enzymes, additives, and bread improvers also accelerated this differentiation.
Flour water absorption capacity remains one of the most critical parameters for bakers. The math is simple: if bakers can produce more dough – respectively, more bread – from the same weight of flour, they could make more products with less flour. With this mindset, millers who consistently delivered flour with a higher absorption capacity have been valued for this perceived economic benefit for years.
However, as the baking process has become more automated in recent years and more baking experts, or master bakers, are retiring or exiting the industry, there is a significant lack of understanding of what influences water absorption capacity. Without this knowledge, many industrial baking operations could risk their bottom lines.
Dough is a complex and unique system
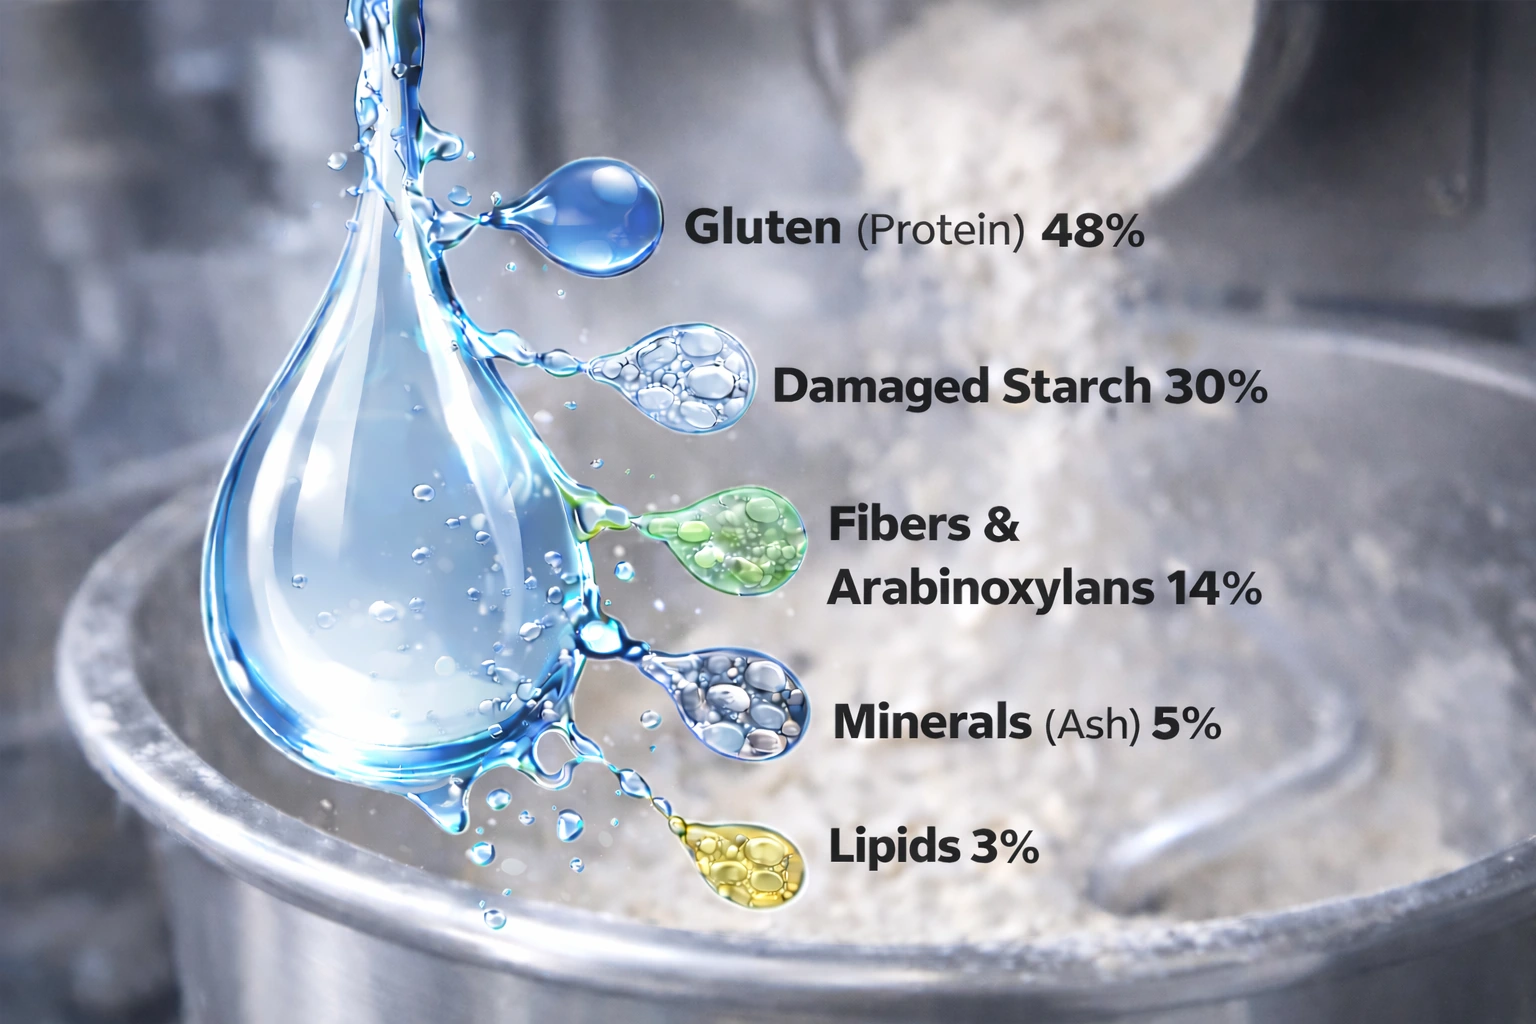
Many scientists have worked over the years to understand the dynamics of how water and flour combine to create dough. For standard white wheat flour, there is a consensus that the primary contributor to water absorption capacity is gluten (protein) quantity and quality. Indeed, gluten does represent about 50% of the influence on flour water absorption capacity and is often the quality parameter cited most clearly in the miller’s Certificate of Acceptance (COA) documentation for their outgoing flour. But what about the remaining ~50%?
Damaged starch is next in importance for its influence. While present in small amounts, damaged starch is highly capable of binding with water. Then, fibers and arabinoxylans comprise the third influence category, followed by minerals (ash) and lipids to a lesser extent.
For the average baker without a cereal science background or flour testing tools, it is quite common to find that using flour that meets a miller’s COA (based mainly on protein/gluten content) can still cause issues – like sticky dough, low volume, or over-proofing – even when using the same recipe and process as before. This is why understanding the factors contributing to water absorption is important. As with many things in baking, the best and most consistent products result from a clear balance in flour composition.
Same water absorption, but different dough behavior?
Figure 1 compares four flour samples with the same water absorption capacity (55%, as determined by first analyzing the flour samples with a Mixolab Universal Dough Characterizer). Not only is water absorption the same, but so are all indicators of traditional dough-mixing characteristics (mixing time, dough stability, weakening). By this logic, the four samples should perform the same – except they did not.
The results showed a 12% difference in bread volume between samples marked FRA-20 and USA-6, indicating a significant gap. What caused this variation?
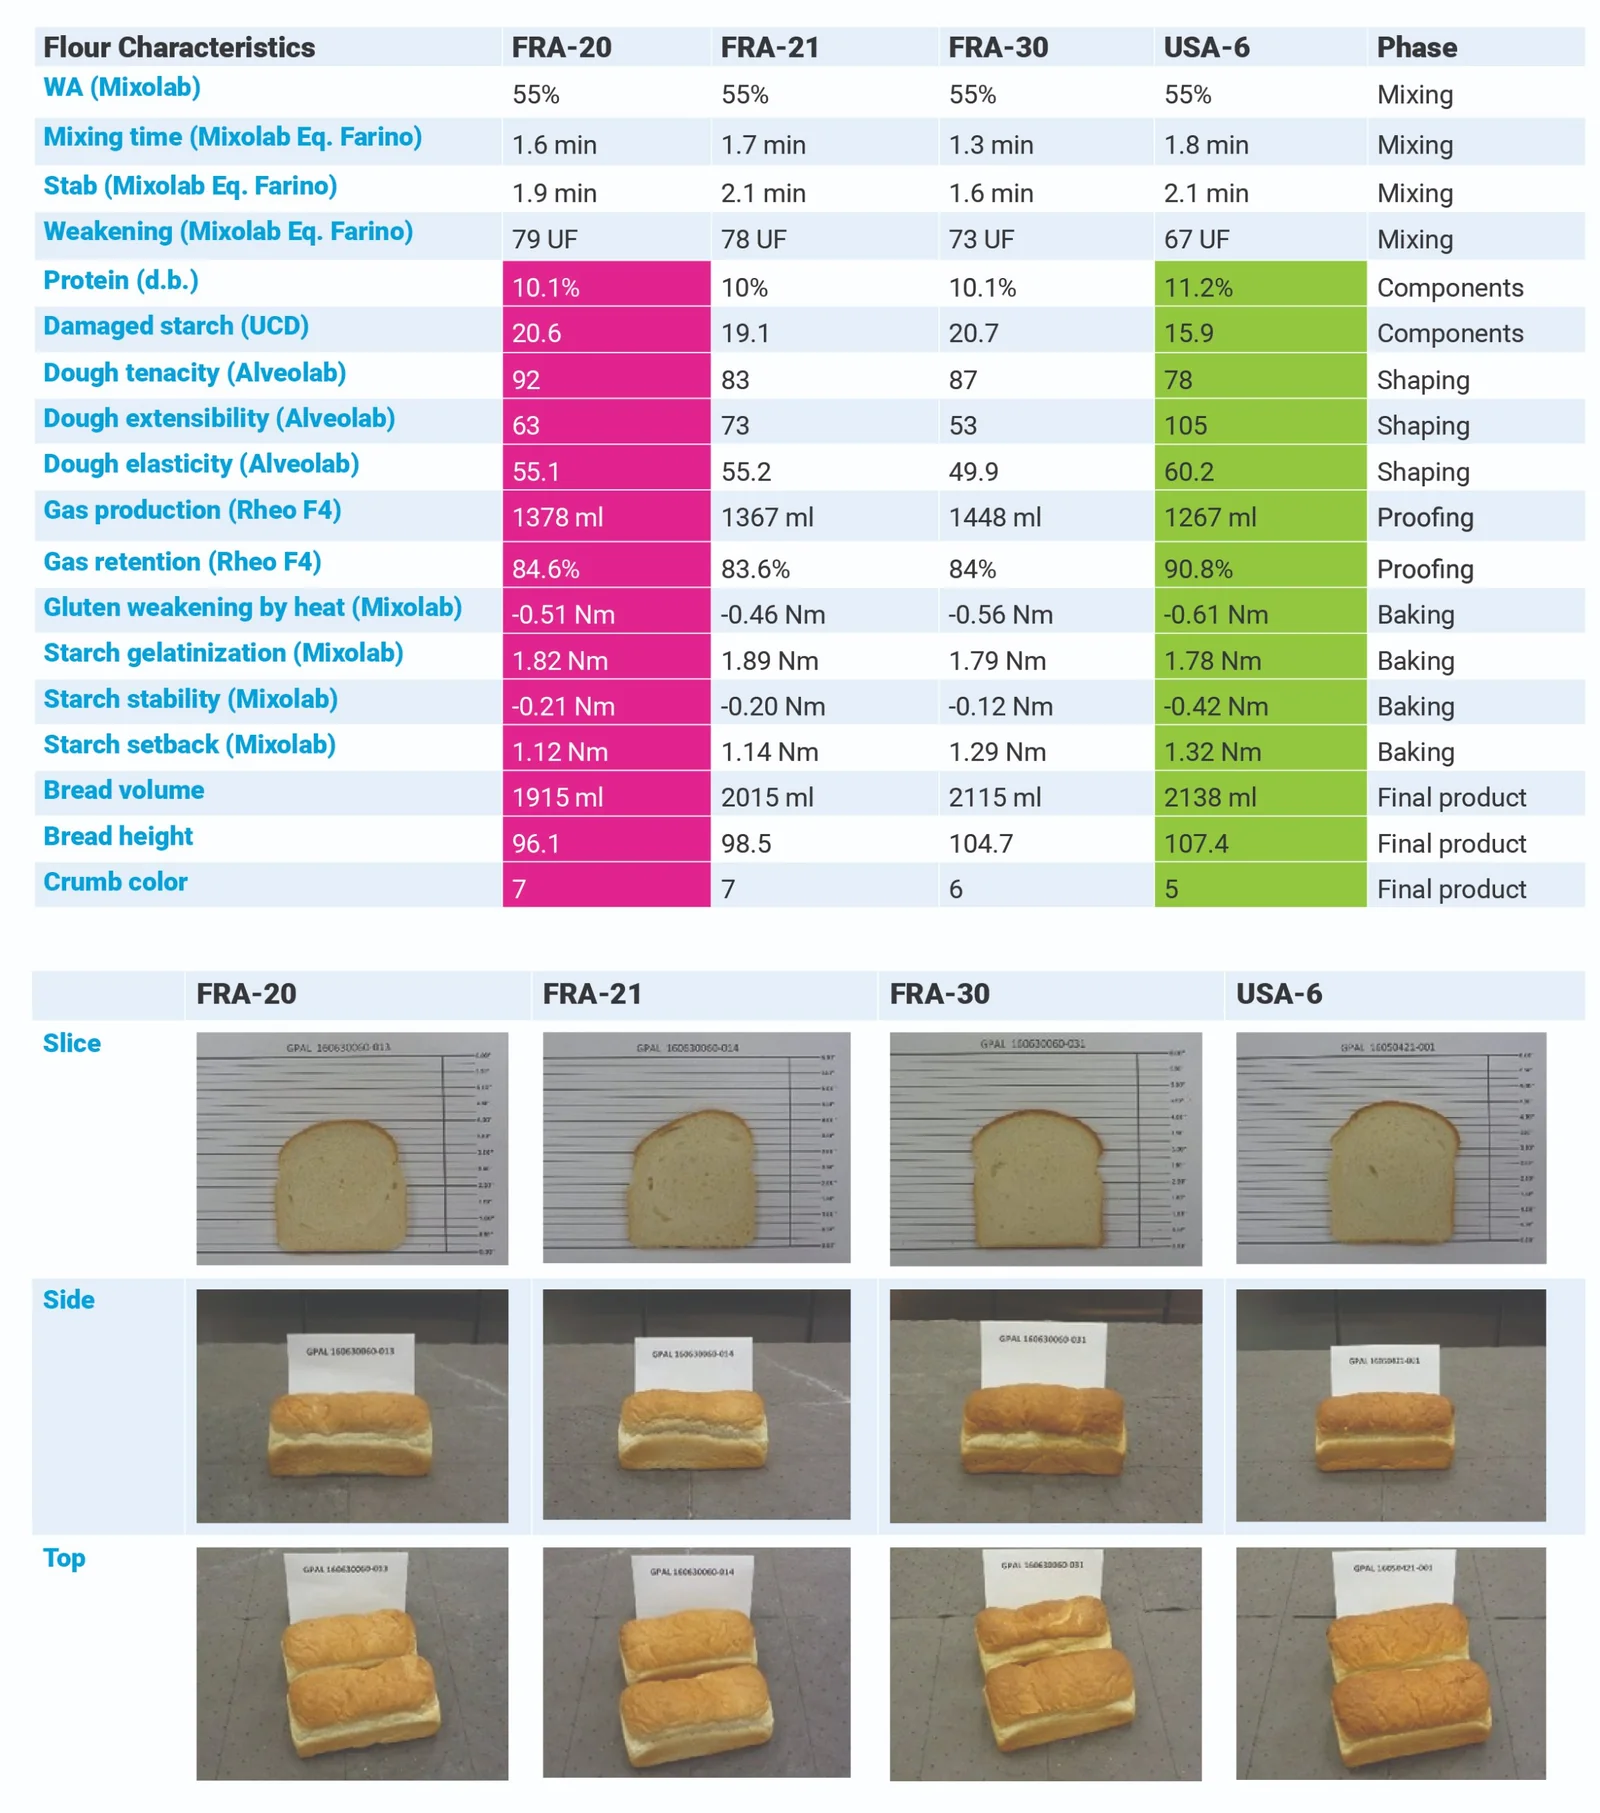
Firstly, the higher protein content and lower damaged starch in USA-6 contrasted with those of FRA-20, meaning that protein ultimately drove the higher water absorption capacity. Then, a subsequent Alveograph test on the flour samples indicated different machinability, with lower tenacity, better extensibility (which helps the molding phase), and higher solid elasticity, resulting in better gas retention with the USA-6. This supported a more stable proofing phase, helping build bread volume.
Then, during the baking phase (again measured with the Mixolab), the lower gluten resistance to heat stress helped increase alveolar growth and improve oven rise in the USA-6 sample. Lower starch gel and starch resistance also positively impacted the crumb structure.
The purpose of the study was to showcase the importance of understanding the intricacies that affect water absorption, which is typically limited to mixing property function. A well-fitted flour not only has the correct water absorption but also has the proper characteristics during the baking phase.
How can bakers measure water absorption?
As baking expertise leaves the industry, subjective dough assessment, mainly pulling a sample of dough from the line to observe and feel its structure, is quickly becoming impractical in today’s baking operations. However, several baking operations have adopted objective, data-driven laboratory tools to help apply ‘numbers’ to what bakers are seeing or feeling in their doughs.
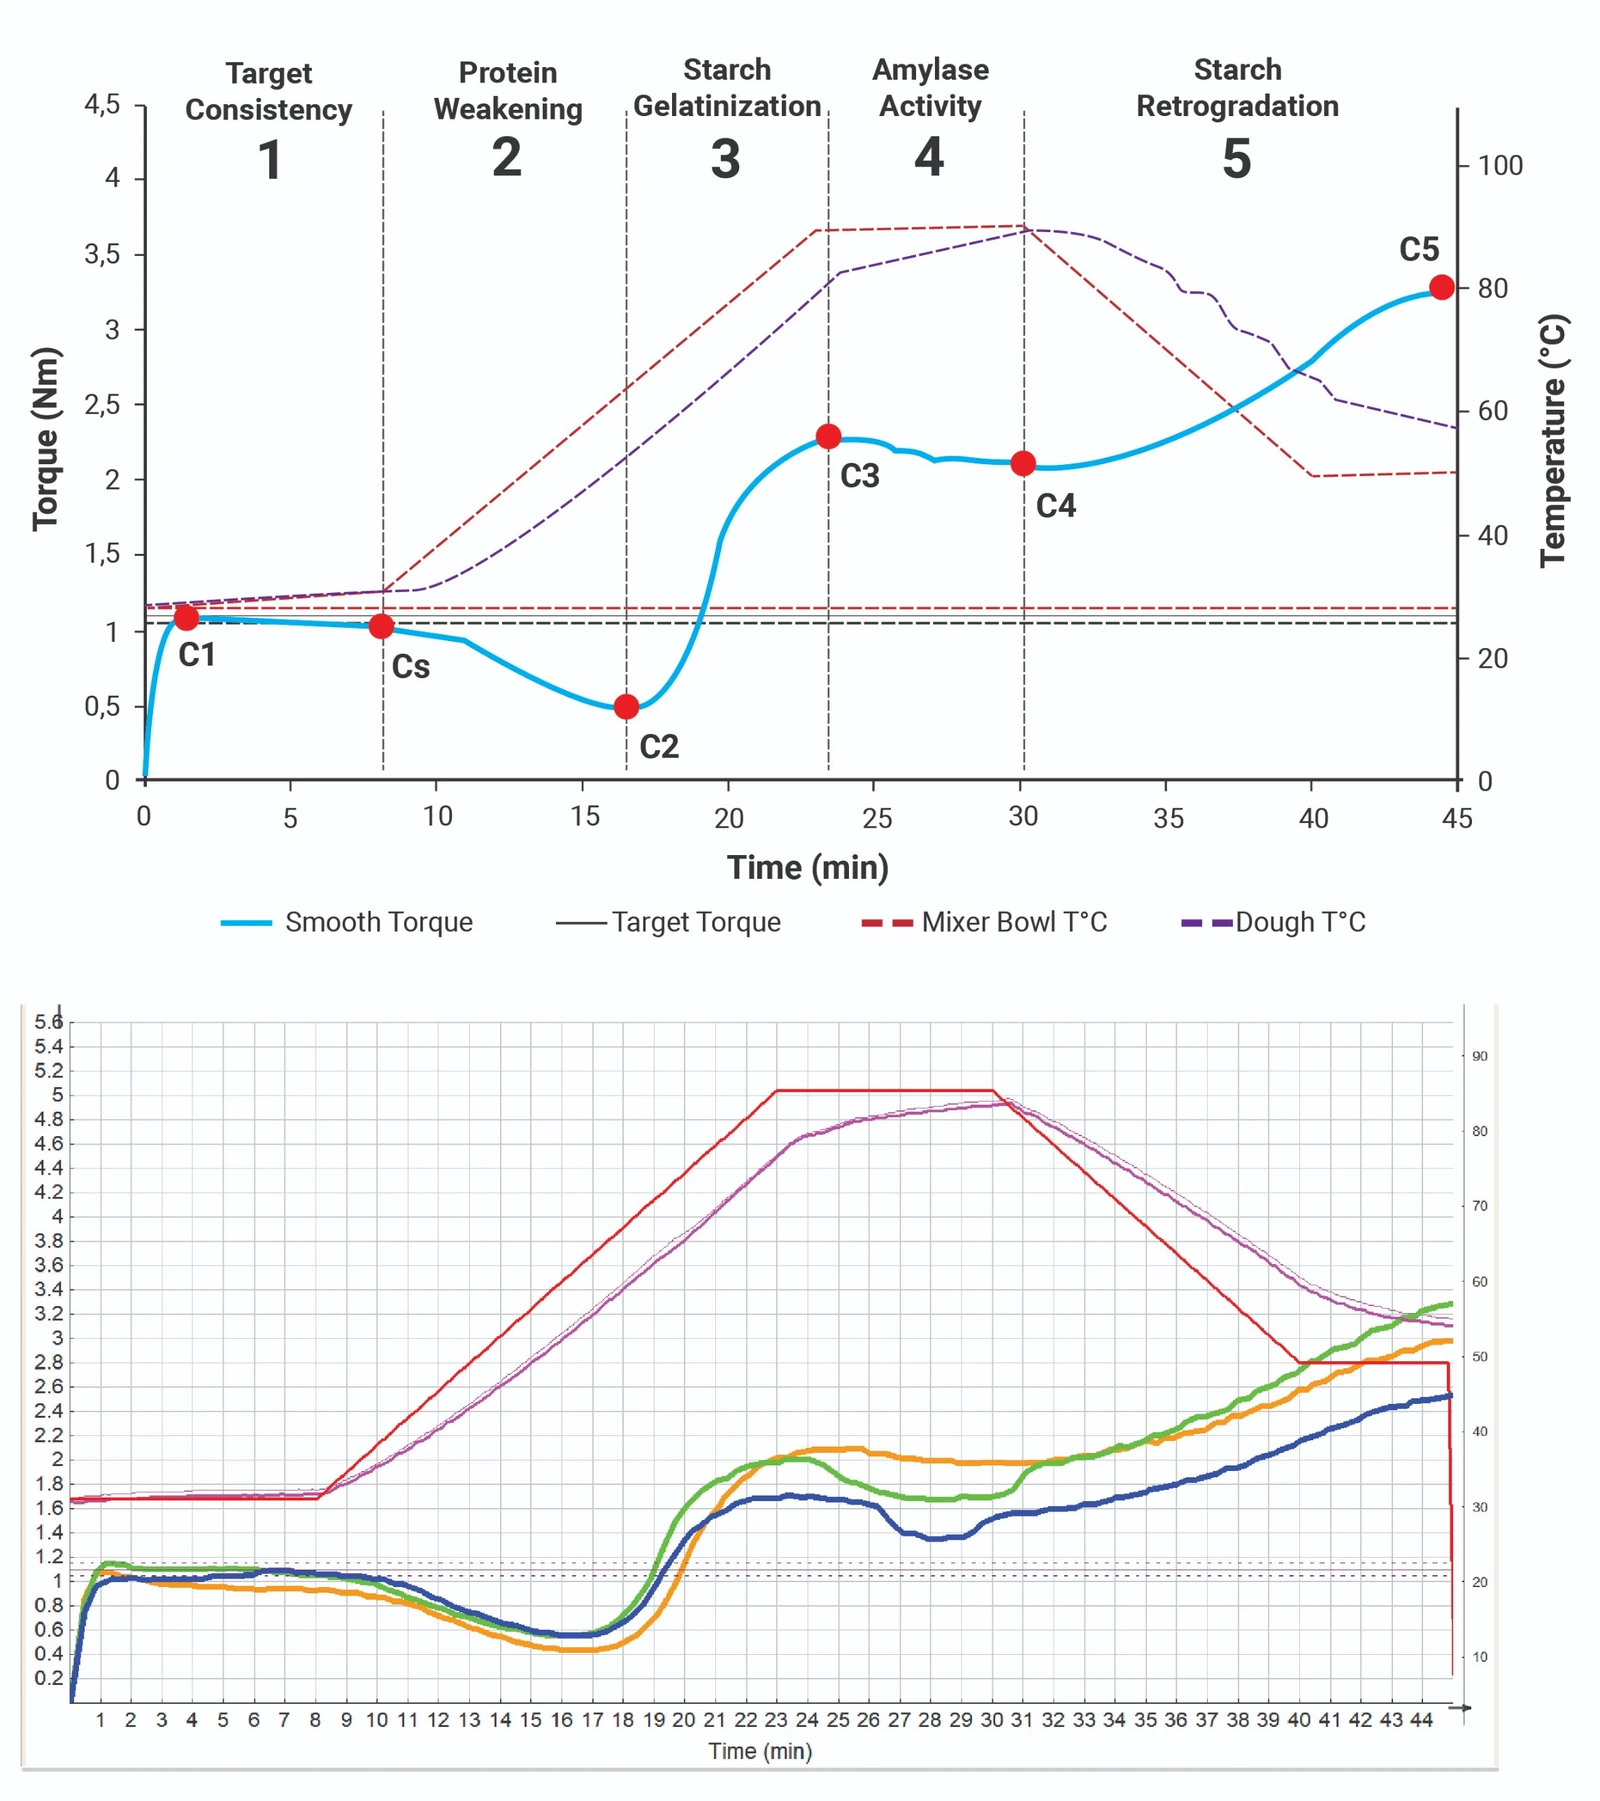
A simple test on a dough characterization instrument, such as the Mixolab (Figure 2), can produce an easy-to-follow data curve that simulates the entire baking process in about 40 minutes. It identifies mixing properties (dough stability), gluten resistance to heat (oven spring), starch gelatinization and stability (crumb structure), and shares evidence on product shelf life after cooling.
Realistically, a flour’s water absorption capacity depends on the baker’s preferred dough consistency target. A dough characterization tool can help build this dough consistency target, which can be shared with the baker’s miller to help close the quality control gap. This method, where the baker’s unique process and product line drive the flour quality COA rather than the miller’s sole input, is a great way to align protocols more closely with the baker’s actual conditions.
Merging lab tools with baking know-how
When the miller can better understand the baker’s baking conditions using objective lab tools instead of a ‘non-representative’ protocol, they are better equipped to get as close as possible to the baker’s target conditions. Then, from the baker’s perspective, frequent sampling can offer recommendations to production teams on increasing or decreasing water input, based on observations of what is good for the baking process.
With these two factors working together, all decisions for correcting a given flour can be made by observing the dough under baking conditions, helping lead to better-informed bakers, more consistent products, and ultimately happier customers.