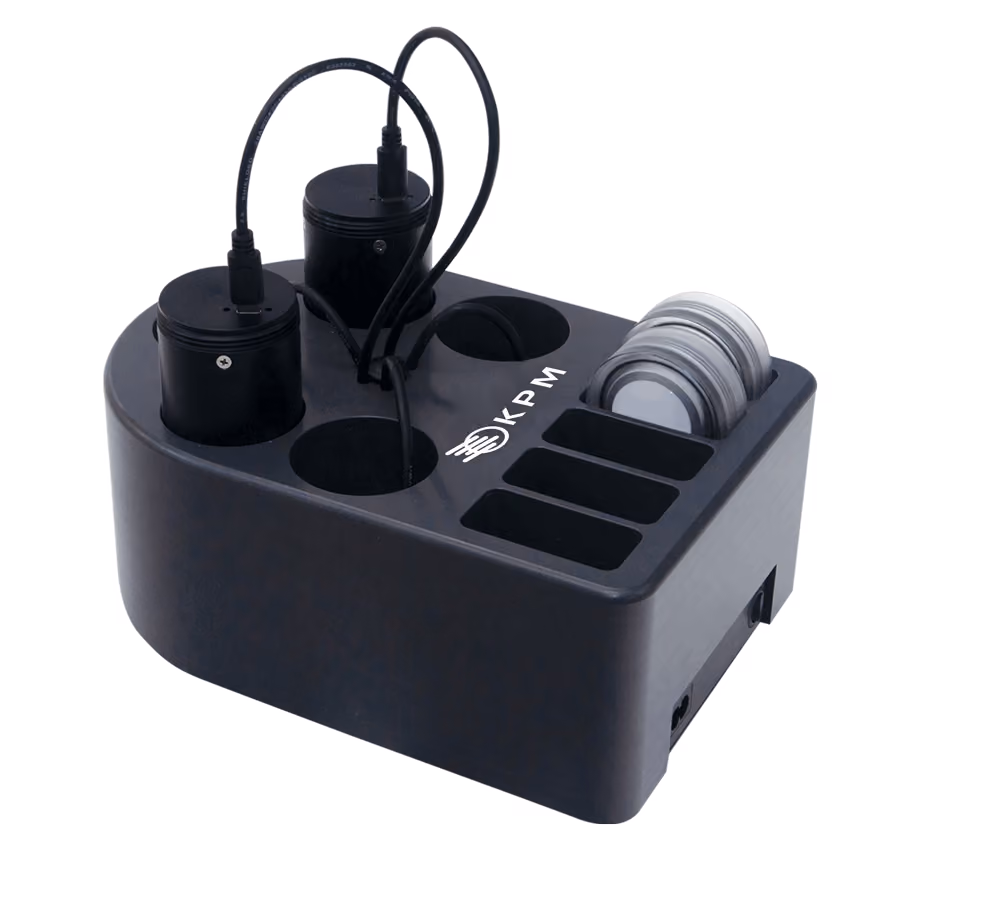
iCinac Wireless is a fully integrated system for monitoring Lactic Acid Bacteria fermentation kinetics that allows for a complete modular build and design. It permits running different kinetics fermentation experiments for Lactic Acid Bacteria via its pH/Temp and pH/ORP/Temp electrodes. The electrodes communicate wirelessly with the receiver using transmitters. iCinac Wireless allows for a completely modular product build and can be expanded when desired with the acquisition of new transmitters and electrodes.
Acidification Analyzers
iCinac Wireless is an alternative for laboratories that want to perform L.A.B. kinetics monitoring without the bioreactor control part that the iCinac Wired offers. iCinac Wireless allows operators the possibility to reduce the number of cables in their experimental area, reducing their overall experiment and design area footprint.
See how the iCinac is used within the scientific community:
Google Scholar: https://scholar.google.com/scholar?hl=en&as_sdt=0%2C5&q=icinac+alliance&btnG=
National Center for Biotechnology Information: https://www.ncbi.nlm.nih.gov/pmc/?term=icinac
Benefits
- Ensures inter-batch kinetics consistency in compliance with ISO standards
- Reduces product development timelines because of the reactor-scale, efficient design and your choice of ferment
- Allows you to adapt the configuration to your needs (current and future)
- Wired or wireless version (or combined); select the number of channels, the number of electrodes, and subsequently add or remove electrodes from the systems
- Improves quality control, R&D, product development and process optimization
Features
- Unique solution designed for acidification activity of L.A.B.: simultaneous monitoring of pH, temperature, and Oxidation Reduction Potential (ORP).
- Uses ISM® protocol digital electrodes (pH/Temp, pH/ORP/Temp)
- Scalable – up to 32 channels with the wired version, and 16 channels with wireless
- Meets ISO 26323|IDF 213, the industry standard for determining dairy cultures’ acidification activity
- Each electrode or channel is independently monitored while providing full control and insight into each experiment
- Easy-to-use software – results in real-time automatic configuration and detection of connected module
Applications
The iCinac Series is used in many industries, and monitors the acidification activity of ferments and control of L.A.B. fermentation reactors in:
- Dairy
- Fermented foods (L.A.B.)
- Probiotics
- Ferment and bacterial culture production
The iCinac is also a useful tool in R&D, product and process development and quality control to:
- Find the most efficient starter for manufacturing needs
- Check batch consistency of the starter
- Determine the acid forming characteristics specific to the phylum studied
- Provide the insight needed for precise development, test, and process control of fermentation ingredients
- Define and control the appropriate inocula by characterizing the acid formation of a specific phylum and knowing the specific test parameters' influence


Product Lineup
Other Models in the Series
How it Works
The iCinac Operations
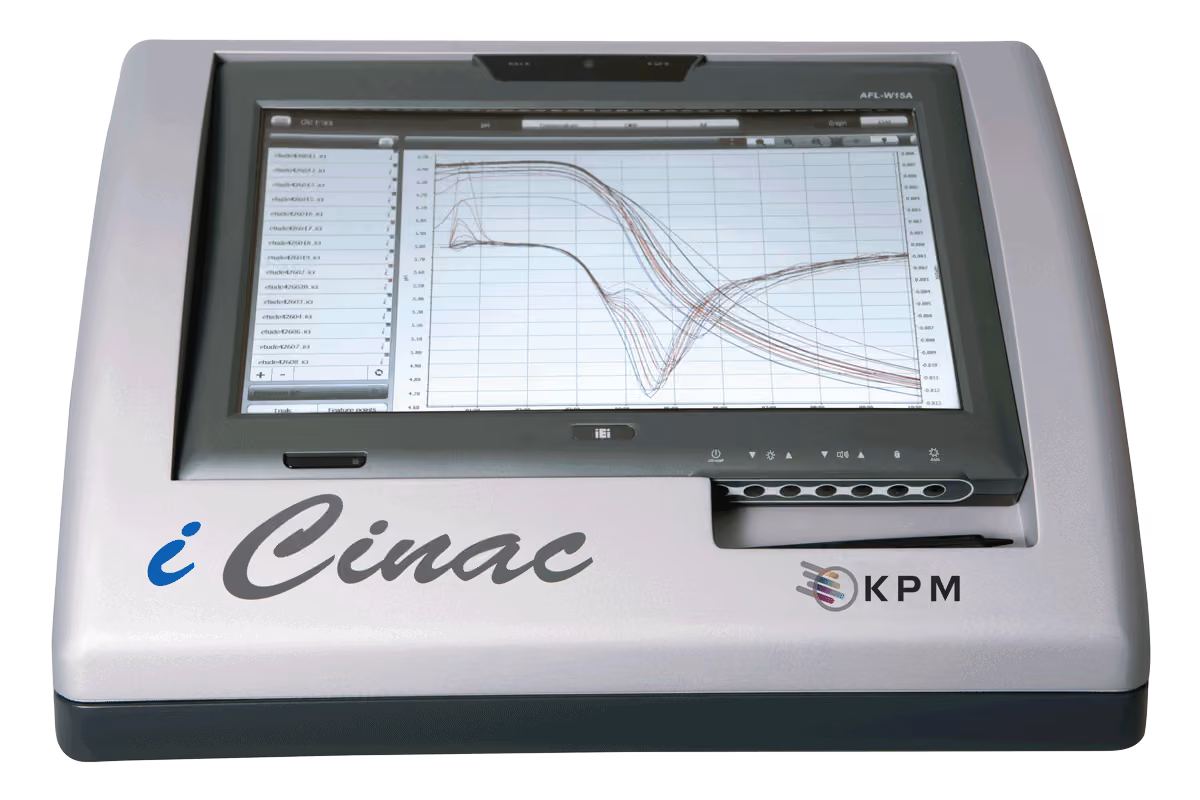
The iCinac, when used as a L.A.B. activity and kinetics monitoring system, works by measuring the pH and temperature in each reactor cell and this is represented as a pH vs. time, Temperature vs. Time, and ORP vs. Time series of graphs. Users can then:
- Compare the curve (kinetics) to defined Gold Standard or specific kinetics to see if the tested batch behaves as expected - a quality control step, in compliance with ISO26323
- Analyze new ferment strains kinetics and behavior under specific conditions
- Develop inter-comparison studies between batches, strains, external conditions, and more
A Simple Test, Without Much Preparation

Experiments can be easily set up for iCinac Wireless:
- Turn on the iCinac Wireless
- Connect all required transmitters and electrodes
- Perform the calibration of all electrodes (pH calibration should be run before each experiment as per the defined protocol)
- Insert the electrode in the dedicated bioreactor and adjust the bioreactor conditions
- Start the iCinac Wireless experiment and initiate to obtain real-time data via the built-in PC
- Analyze your data at the end of the experiment

System Components
Software
Intuitive, User Friendly Features:
- pH/ORP temperature compensation management
- Monitor and track trial set points
- Control external modules (digital / analog output)
- Calculate all feature points
- Real time data logging
- Diverse graphical plotting
- pH calibration history
- Libraries management and creation (average curves, standard deviation, etc.)
Simulating Process Conditions for Phylum Study
By programming a thermal cycle, users can reproduce or simulate the changes in process conditions (e.g., variations in temperature or pH) and use the graphs or descriptors to compare the potential effects on the phylum studied.
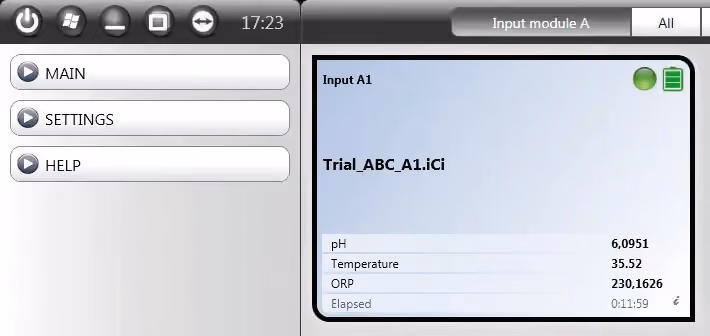
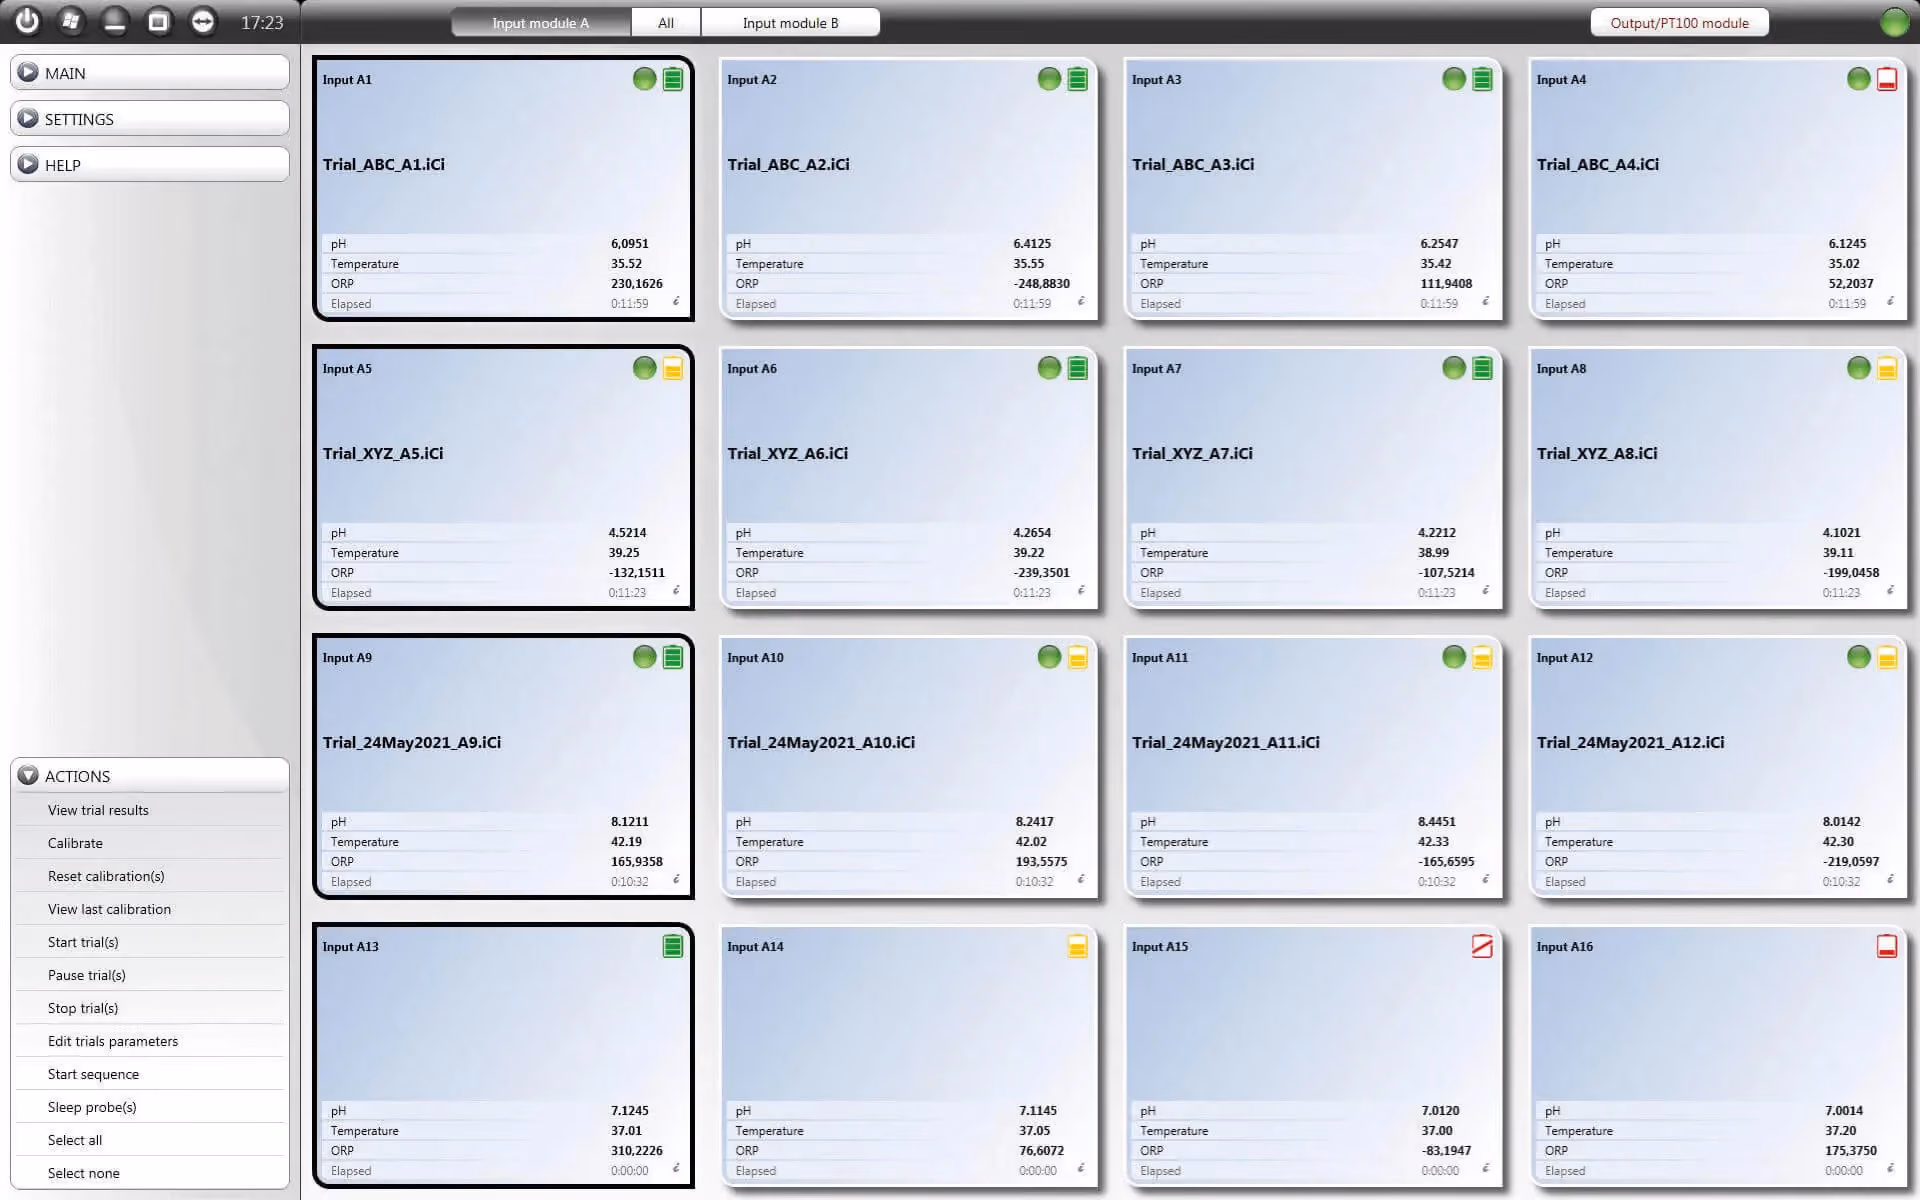
Each channel is shown in an independent window.
Simulating Process Conditions for Phylum Study
By programming a thermal cycle, users can reproduce or simulate the changes in process conditions (e.g., variations in temperature or pH) and use the graphs or descriptors to compare the potential effects on the phylum studied.
Each channel is shown in an independent window.
Advanced Analysis of Fermentation Kinetics
The iCinac software can perform complex multivariate analyses of the trial curves in order to extract key characteristics of the curve associated with the kinetics of the fermentation. Feature points are useful in comparing the effects of variations in standard conditions on the overall acidification kinetics. Most common feature points for the determination of acidification activity are automatically programmed within the software, but a variety of feature points are user-customizable in order to automatically extract the most useful data from the specific fermentation curves being analyzed.
.avif)
.avif)
Dynamic Data Visualization
Real-time graphical presentation of data and integrated pre-programmed data analysis capabilities display the key characteristics of the studied strain without additional user input. Users can create average curves to build a reference database to overlay and compare with new trials. And, personalized profiles can be created for ultimate characterization of the trial activity.
.avif)
Simplified Feature Data Extraction
Tabular display of feature acidification characteristics, for each curve, can be automatically extracted from the raw data for simplified data analysis.
Simplified Feature Data Extraction
Tabular display of feature acidification characteristics, for each curve, can be automatically extracted from the raw data for simplified data analysis.
Flexible Licensing
The iCinac software license allows you to install it on multiple computers. This gives you the possibility to retrieve data from your PC while the iCinac is occupied with measurements. In addition, the iCinac software enables you to send emails or SMS to inform users of specific events (reached pH, end of run, alarms, etc.)
Specifications
Related Resources