The Science Behind Dough Elasticity

What is Dough Elasticity?
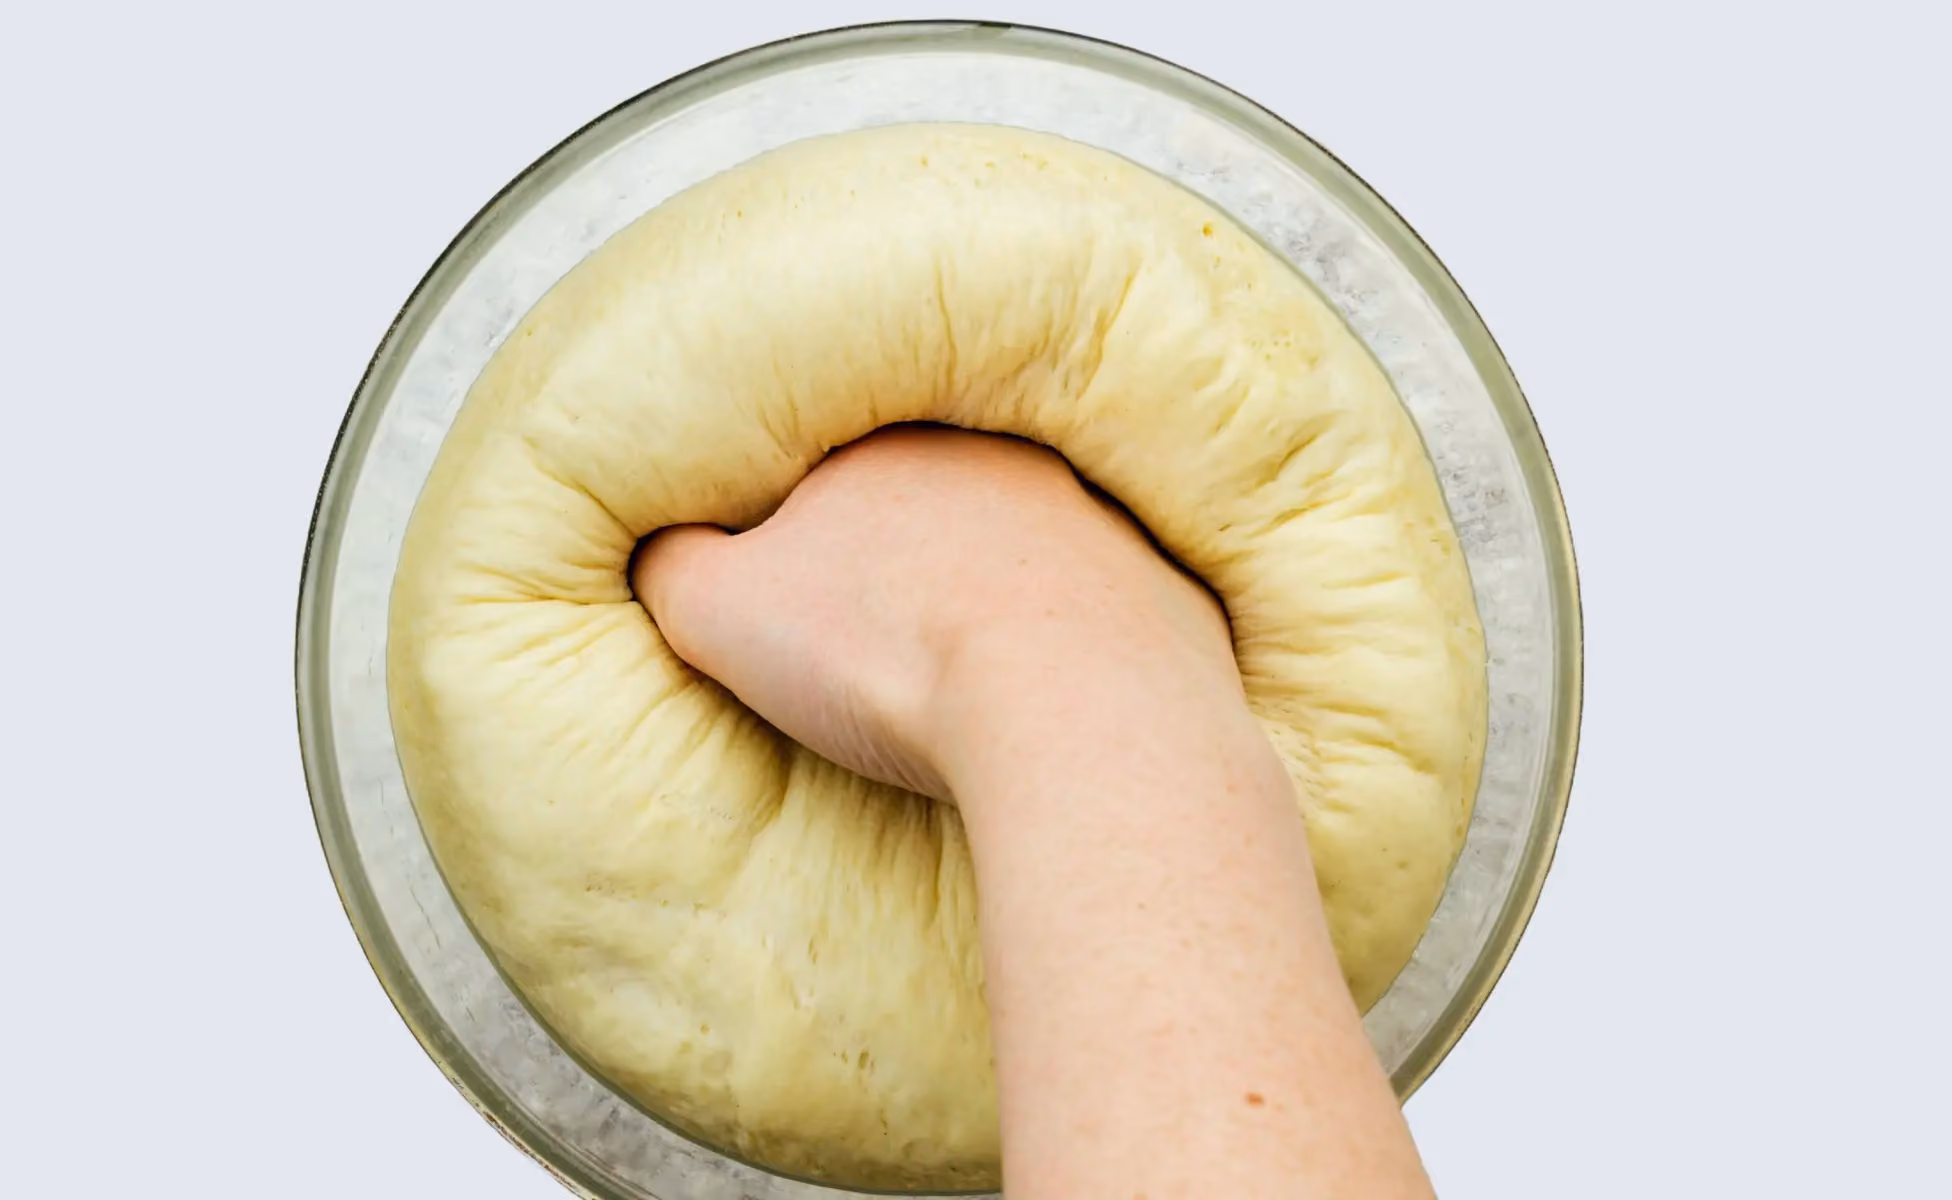
If you stretch a rubber band (or a spring) and suddenly let go of one of its ends, it returns to its original dimensions; that is elasticity. And it should not be confused with extensibility! This notion has already been discussed in another post. Let us simply recall here that extensibility is the capacity of a material to deform without breaking. These two notions are sometimes confused because they are quite complementary. Two extreme cases can be cited:
- If the material is not extensible (for example, a stone) and cannot be stretched, it cannot be elastic.
- A material can stretch but not be elastic. This would be the case for a metal that can be stretched (for example by rolling), but then remains in this state after deformation.
Dough is situated between these two states. We have seen that it must be stretchable, and it must also be elastic. But not too much so.
Why Dough Elasticity Matters
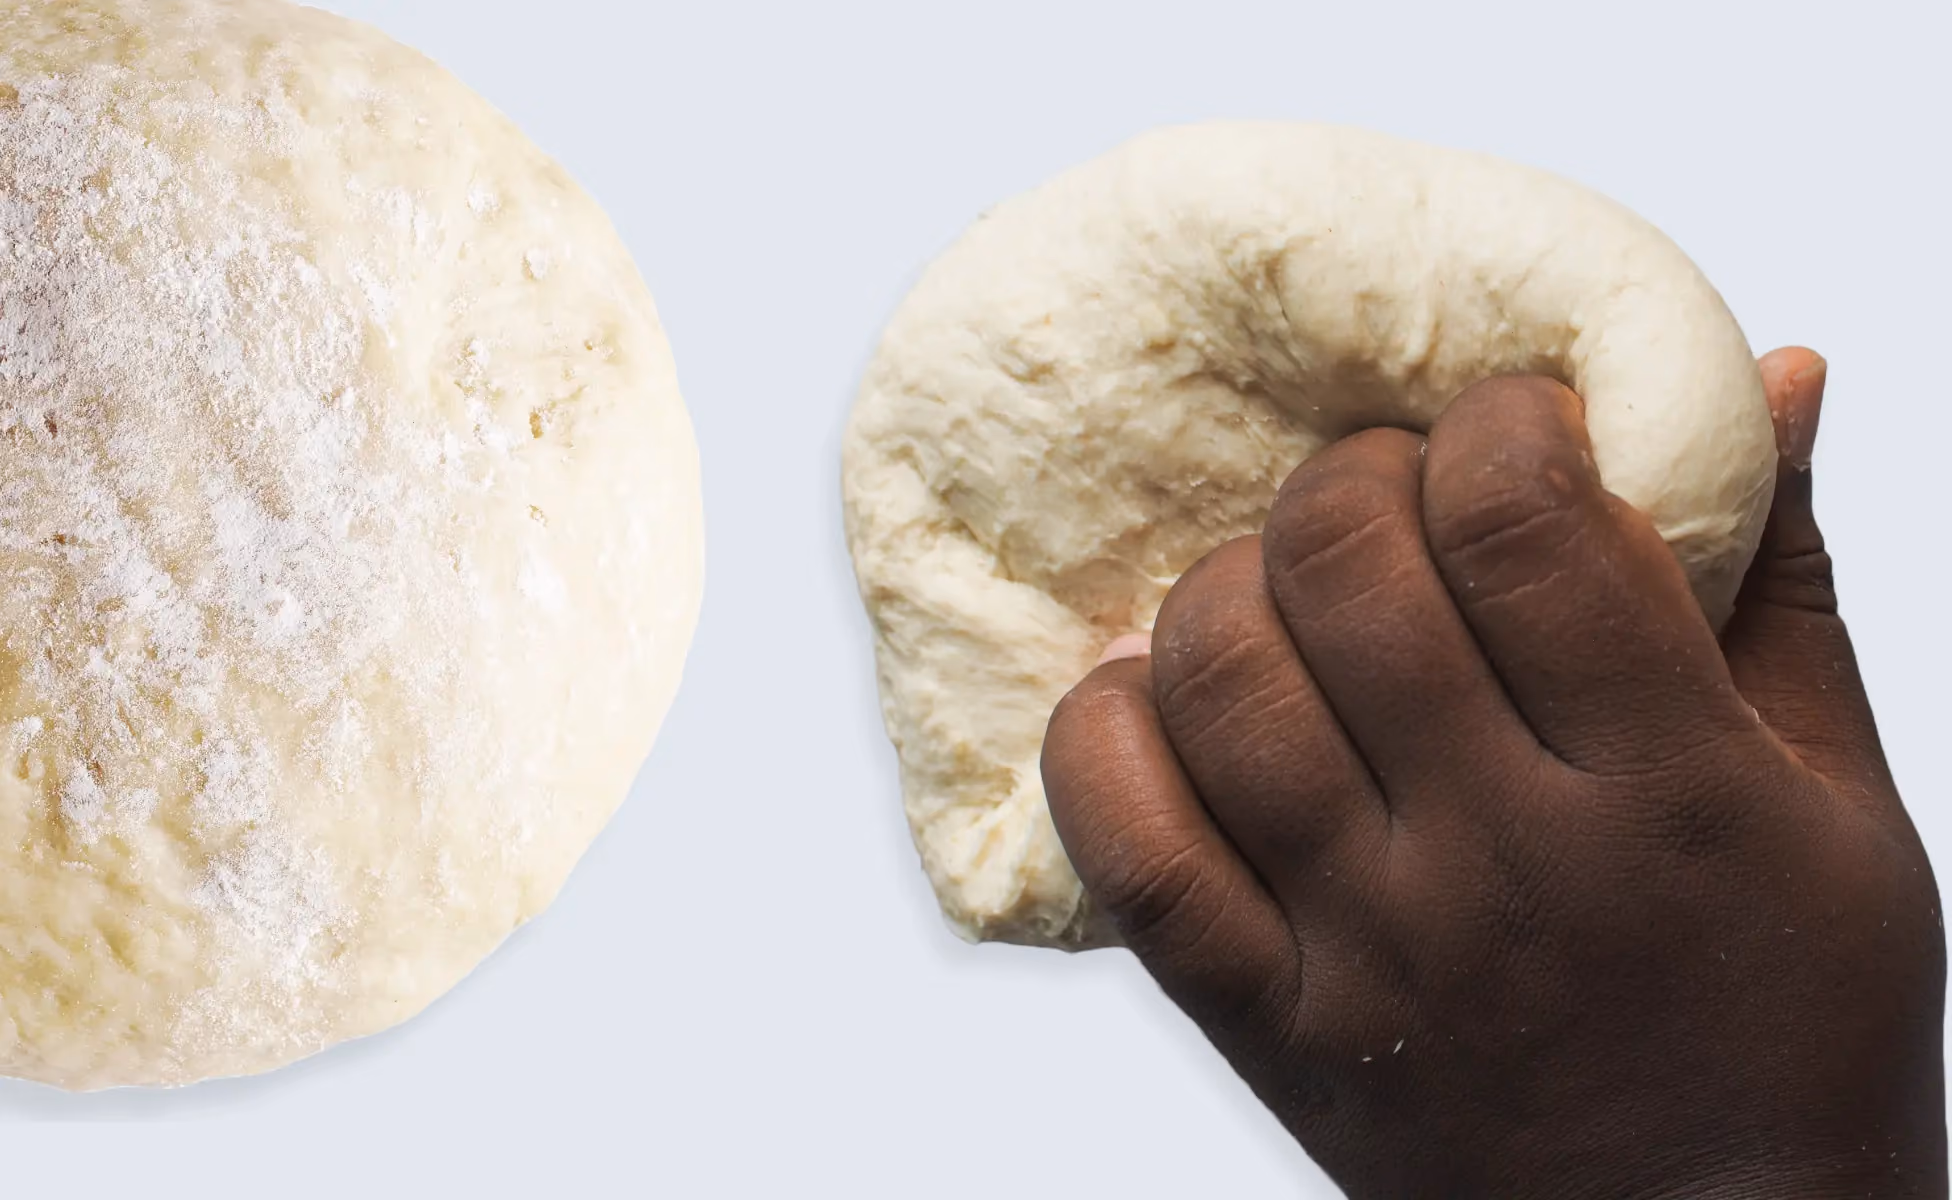
Take the case of a flatbread manufacturer. They knead the dough and form balls that they then rolls out to obtain bread of the right size (extensibility). A few moments later, before baking, the manufacturer realizes that the dimensions of the loaves have significantly decreased. Elasticity is the cause.
In the 1990s, there was a very popular variety of wheat in France that sometimes exhibited too much elasticity. The bakers who tried to produce standard baguettes (about 65 cm long) could adjust their dough moulders more and more tightly, but the doughs shrank visibly as soon as they were no longer under stress. Yet another elasticity problem!
It soon became clear that elasticity mainly depends on the quality of the gluten. Without going into too much detail, let's just remember that dough is a viscoelastic medium, and that scientists have established that the viscosity of gluten is linked to gliadins, while the elasticity depends on glutenins. Gliadins and glutenins being 2 of the main proteins that make up gluten.
The Alveograph Solution
At the time, there were no simple ways to measure this phenomenon, and therefore to control it, at the laboratory level. CHOPIN Technologies’ engineers then developed a simple solution based on previous observations using the Alveograph.
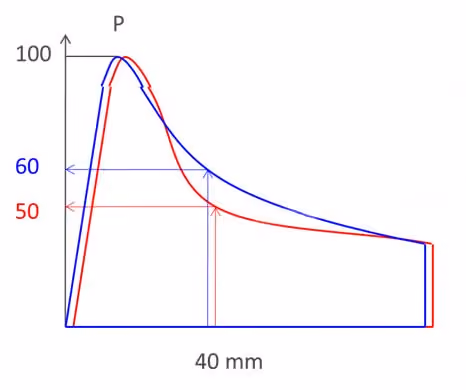
They found that the curves corresponding to the problematic flours tended to collapse less, as defined by the tenacity of the dough. The “hollow” being measured on the curve between the P value distance point and the L value distance point.
A first attempt consisted in measuring the internal pressure in the bubble after having injected 200 ml--a measurement known as P200.
Why P200 measured at 40mm?
Some figures:
- When properly calibrated, the Alveograph pump delivers 96 litres of air/hour.
- Or 96,000 ml/3600 seconds = 26.67 ml/s
- It will therefore take 200/26.67 = 7.49 seconds to obtain 200ml.
- On models with a pressure gauge, the indicator advanced by 5.5 mm/s
- 49 x 5.5 = 41.2 mm which rounds to 40.
Why choose 200 ml?
For practical reasons.
- The dough needs to be inflated enough to be sure that the bubble starts to deform.
Do not wait for:
- evaluation to be possible on a maximum of curves (even for short L values)
- Avoid being in an “end of curve” area with less elastic resistance.
The researchers soon realized that the concept was promising but insufficient if used alone. It is indeed possible to have the same P200 for very different flours without this result necessarily being linked to elasticity alone. They then improved the idea by comparing this P200 to the maximum pressure recorded just before the "P" distance of the tenacity point. Thus the elasticity index was developed:
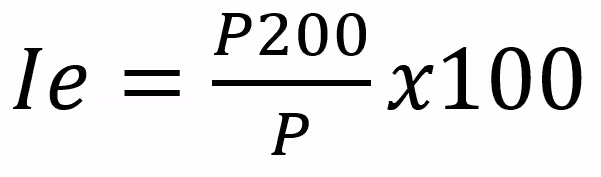
To really understand this, imagine 2 flours with the same value for P (100, for simplicity's sake). These flours differ in their P200 measurement; one is 50 (thus an “Ie” of 50%) and the other is 60 (an “Ie” of 60%). So what has happened? The two flours have the same tenacity. After injecting 200 ml of air, the internal pressure in one is higher than in the other. The only mechanical possibility is that at this precise moment, the flour bubble at Ie 60 is smaller than that of the Ie 50 bubble (at constant temperature and for a given volume of air, the pressure is higher if the volume of the container is smaller).
But why would the bubble be smaller?
Because it is more resistant to deformation. Later work has discussed "strain hardening" (or "écrouissage" in French). This term describes the ability of a material to increase its resistance to deformation. In our case, this resistance is elastic. Hence the term elasticity index.
Although it has been around for almost 30 years, the elasticity index is still disregarded by Alveograph users. This is certainly a mistake because many real cases (often linked to product size issues) have found a solution by better understanding this index.
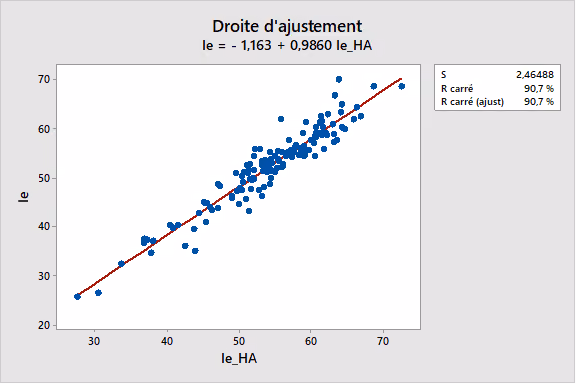
In addition, the elasticity index is hardly affected by protocol and hydration conditions, as shown in Figure 1. It is a more direct indicator of the quality of the proteins, and experience shows that for each manufacturing process, there is an optimum (sweet spot). We can only encourage current and future users to seriously consider using the elasticity index .
To learn more about our solutions for flour and dough quality, visit our solutions here.