How Vision Inspection Data is Used to Improve Food Quality & Safety

By now, most people in the food production industry know that Vision Inspection Systems can contribute significantly to quality control. But you might not know that these systems collect a wealth of data that, when used effectively, can help companies uncover the root cause of production problems, improve overall processes, mitigate food safety & quality issues, and gain a competitive edge.
In this post, we’ll explore how a vision system captures data, how it can be leveraged, and how it’s transforming the food industry.
A Quick Review of What Vision Inspection Systems Are
In a nutshell, the purpose of a Vision Inspection System is to capture high-resolution images of items that travel beneath it at full speed on a production line, analyze those images and capture measurements, and based on pre-defined criteria make decisions about the acceptability of each item.
The Types of Vision Systems Used in Food Processing
Depending on the application, various options and configurations are available, but a simple system configuration in the food industry includes high-resolution cameras, lighting, and image processing software. These systems operate at high speed and high precision to detect flaws at volumes far beyond manual inspection capabilities. Some of the imaging technologies used are:
- 2D/3D Systems: Measures shape, size, depth, color, height, volume, etc. for basic quality control applications
- Multispectral Systems: Capture images in multiple but specific wavelengths of light to detect known contaminants and materials
- Hyperspectral Systems: Breaks images into hundreds of wavelengths to determine the item’s chemical composition, surface defects, and physical contaminants
Where Vision Inspection Systems Can be Used in the Food Industry
Because the configuration is flexible, these systems can be deployed in a variety of food manufacturing and processing settings:
- Meat, Poultry, & Fish
- Baked Goods and Snack Foods
- Fruits & Vegetables
- Prepared Meals
- Frozen Foods
- Dairy
- And more
The Types of Data Captured by Vision Systems
Vision inspection systems don’t just capture images; they generate structured, real-time data that reflects product characteristics and production performance. This data is the foundation for everything from real-time quality decisions to long-term process optimization.
Product Characteristics
- Product measurements (size, shape, volume, thickness/height, area, etc.)
- Visual appearance (bake color, ripeness, consistency, coating & seasoning coverage)
- Weight (with integrated scale)
- Moisture mapping
Product Defects
- Size & shape irregularities
- Bake color variations
- Cracks, holes, breakage
- Spots, blisters, blotchy appearance
- Imprint defects
- Topping presence, and distribution.
- Breading, coating or icing voids
- Old dough and other undesirable inclusions
Physical Contamination
- Foreign materials (PPE, tools, indigenous materials, etc.)
Process Information
- Product variation trends
- Throughput
- Uptime
- Pareto analysis of defects
- Defects by position on the line
- Traceability
How the Food Industry Uses This Data
In food manufacturing, data is only as powerful as the decisions it drives. The data collected by vision inspection systems serves a wide range of functions, from automating real-time quality control decisions on the line to informing strategic, long-term improvements across production sites. Let’s look at it from the perspective of different stakeholders.
Real-Time Quality Control at the Production Line
The most immediate use of vision system data is for automated, real-time decision-making during production:
- Automatic rejection of non-conforming products: If a product falls outside acceptable tolerances (e.g., wrong color, size, or shape), it can be removed instantly via a rejection mechanism that, depending on the product could be comprised of a robot, air nozzles, diverters, flaps or declining conveyors.
- Identification and handling of physical contaminants: Vision systems, especially those using hyperspectral imaging and AI, play a critical role in detecting and rejecting foreign materials in real time, while capturing traceable data.
- Operator alerts and interventions: When defect rates exceed thresholds, operators receive warnings at the line or via a dashboard to inspect or adjust upstream processes.
- Feedback to machine controls: Vision systems can send data back to ovens, presses, or slicers to adjust parameters in real time, minimizing waste before it happens.
Process Optimization and Yield Improvement
When collected over time, inspection data helps engineers and quality managers uncover patterns:
- Which defects happen most often, and when?
- Are they tied to specific products, lines, shifts, suppliers, or ingredient lots?
- How does production speed affect defect rates?
- As changes are made in real time does each change improve the process and reduce waste - this can be measured objectively.
Over time, this contributes to higher yield, better product consistency, and fewer production stoppages.
Supporting R&D and Recipe Development
Beyond production and quality assurance, vision inspection systems are becoming essential tools in food manufacturers' research and development (R&D). By capturing detailed, objective product data during trials and scale-up runs, R&D teams can:
- Quantify visual attributes like bake color, height, spread, or surface texture to validate new recipes or formulations.
- Compare iterations side-by-side using precise data instead of subjective visual assessments.
- Optimize process parameters (e.g., oven temperature, mixing time) based on consistent feedback from vision systems rather than manual checks.
- Accelerate formulation testing, especially when introducing new ingredients, replacing allergens, or reducing salt/sugar/fat.
Offline solutions, like the TheiaVu Vision Measurement System, can be used in the lab and at line to assist with product development and trials.
Compliance, Traceability, and Auditing
Today’s regulatory environment demands transparency. Vision inspection data provides:
- Digital records of inspection results per line, batch, or shift
- Time-stamped traceability logs for recalls or compliance checks
- Foreign material detection records to demonstrate adherence to HACCP and FSMA guidelines
This data can be securely stored, accessed remotely, and shared during audits or quality reviews.
Data-Driven Continuous Improvement, and Strategic Planning
Inspection data can also be exported into business intelligence tools or integrated into MES/ERP systems to support:
- Cost-of-quality analysis
- Supplier performance tracking
- Line benchmarking across multiple plants
- CapEx decisions for line upgrades or expansions
This elevates the value of vision system data from tactical to strategic, aligning quality assurance with corporate goals like waste reduction, sustainability, and brand protection.
Integration With Other Systems - Connecting Vision Systems to the Digital Backbone of Production
To unlock their full potential, vision inspection systems must do more than collect data; they must share it across the production ecosystem. Integration with control systems, analytics platforms, and enterprise software allows manufacturers to turn isolated insights into holistic operational improvements.
Here’s how the food industry connects vision inspection data into the broader digital workflow:
- PLC and SCADA Integration for Real-Time Control
- MES and ERP Connectivity for Enterprise Visibility
- Integrated Dashboards and Remote Monitoring
Case Example - An Industrial Bakery
An industrial bakery had implemented a pretty typical statistical sampling program that they felt would represent the variation they would see in the production process to determine if the process was operating within the defined parameters.
Traditional Quality Control Statistical Sampling Method
In this program, they manually removed 12 buns every 20 minutes (36/hour) from a line producing 800 buns/minute. Each of the grab samples was tested manually for shape, size, color, etc., using multiple methods and tools. That data was then recorded in a spreadsheet, a trend graph was produced, and the data was analyzed to determine the variability.
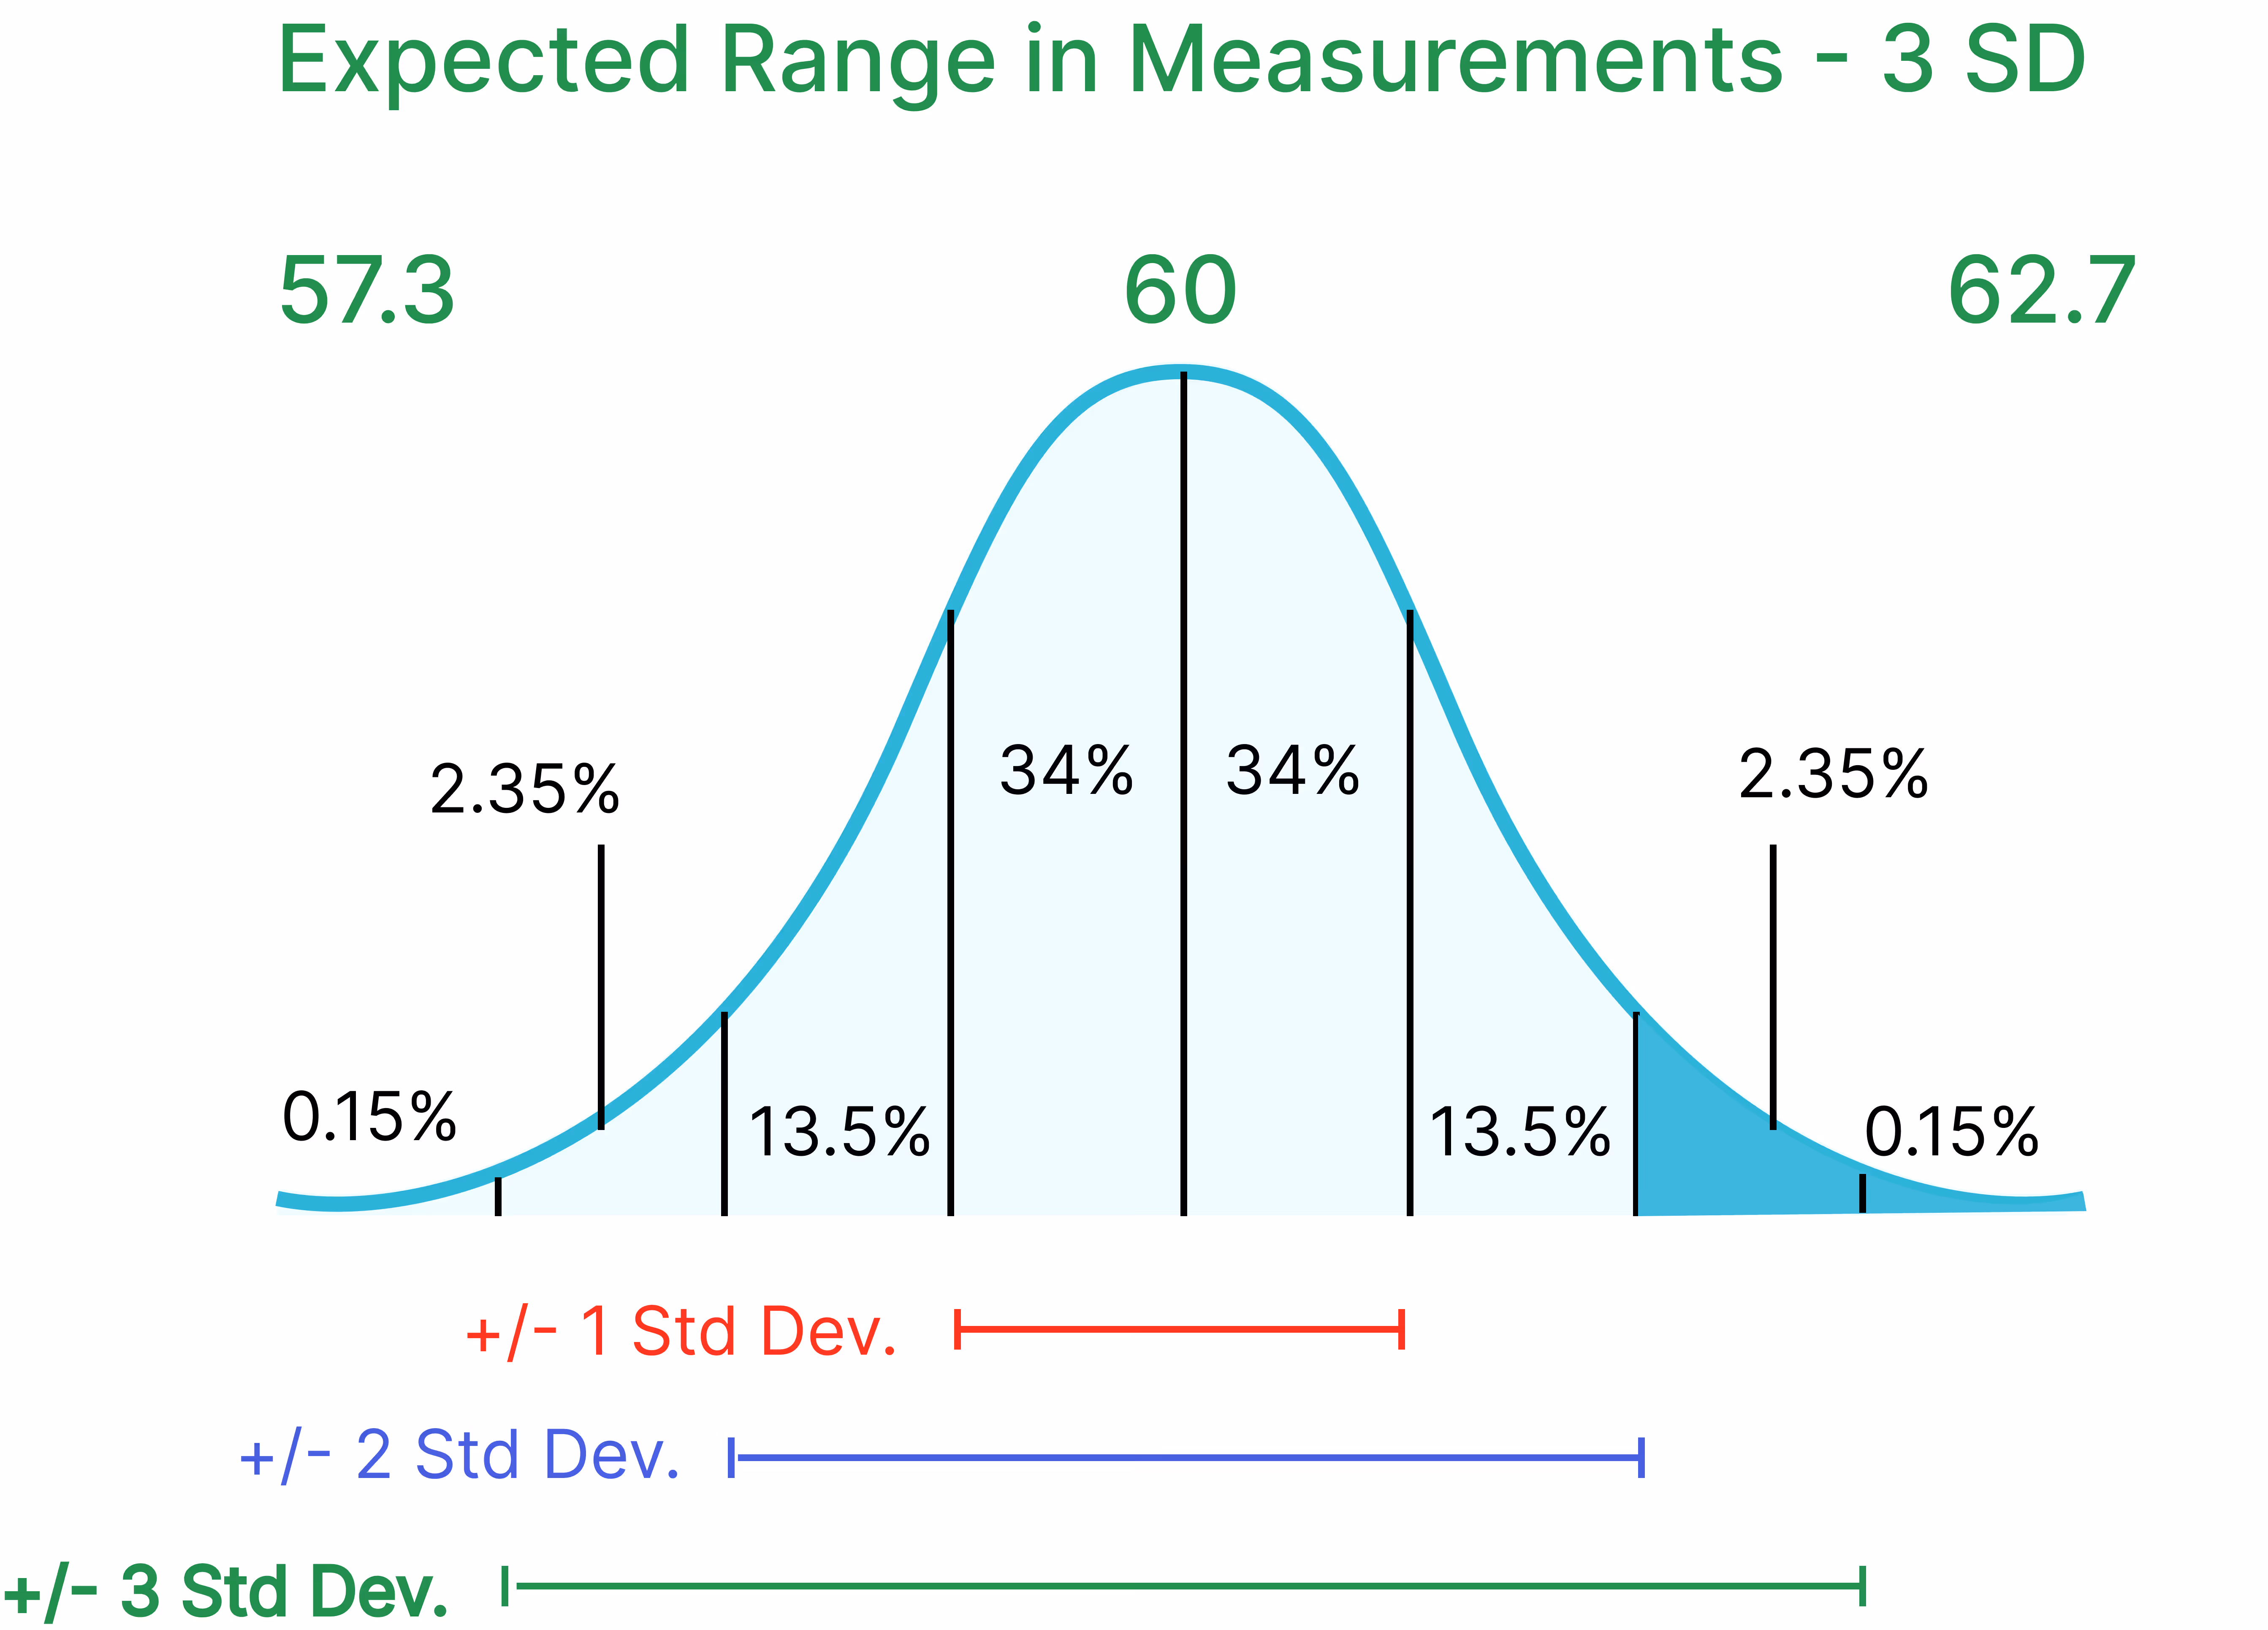
Using bun height as an example, they determined that the average height was 60 mm, well within the specification, and the variability was between 57.3 mm and 62.7 mm, a range of 0.9 mm. Everything looked good!
Automated On Line Quality Control versus Statistical Sampling Method
The company decided to automate the quality checks, so it installed an online vision inspection system and started gathering data from 100% of the products, approximately 45,000 buns/hour compared to 36 buns/hour. Nothing else had changed. It was using the same raw materials, the same production process, and the same specifications.
An Initial Observation - Bun Height
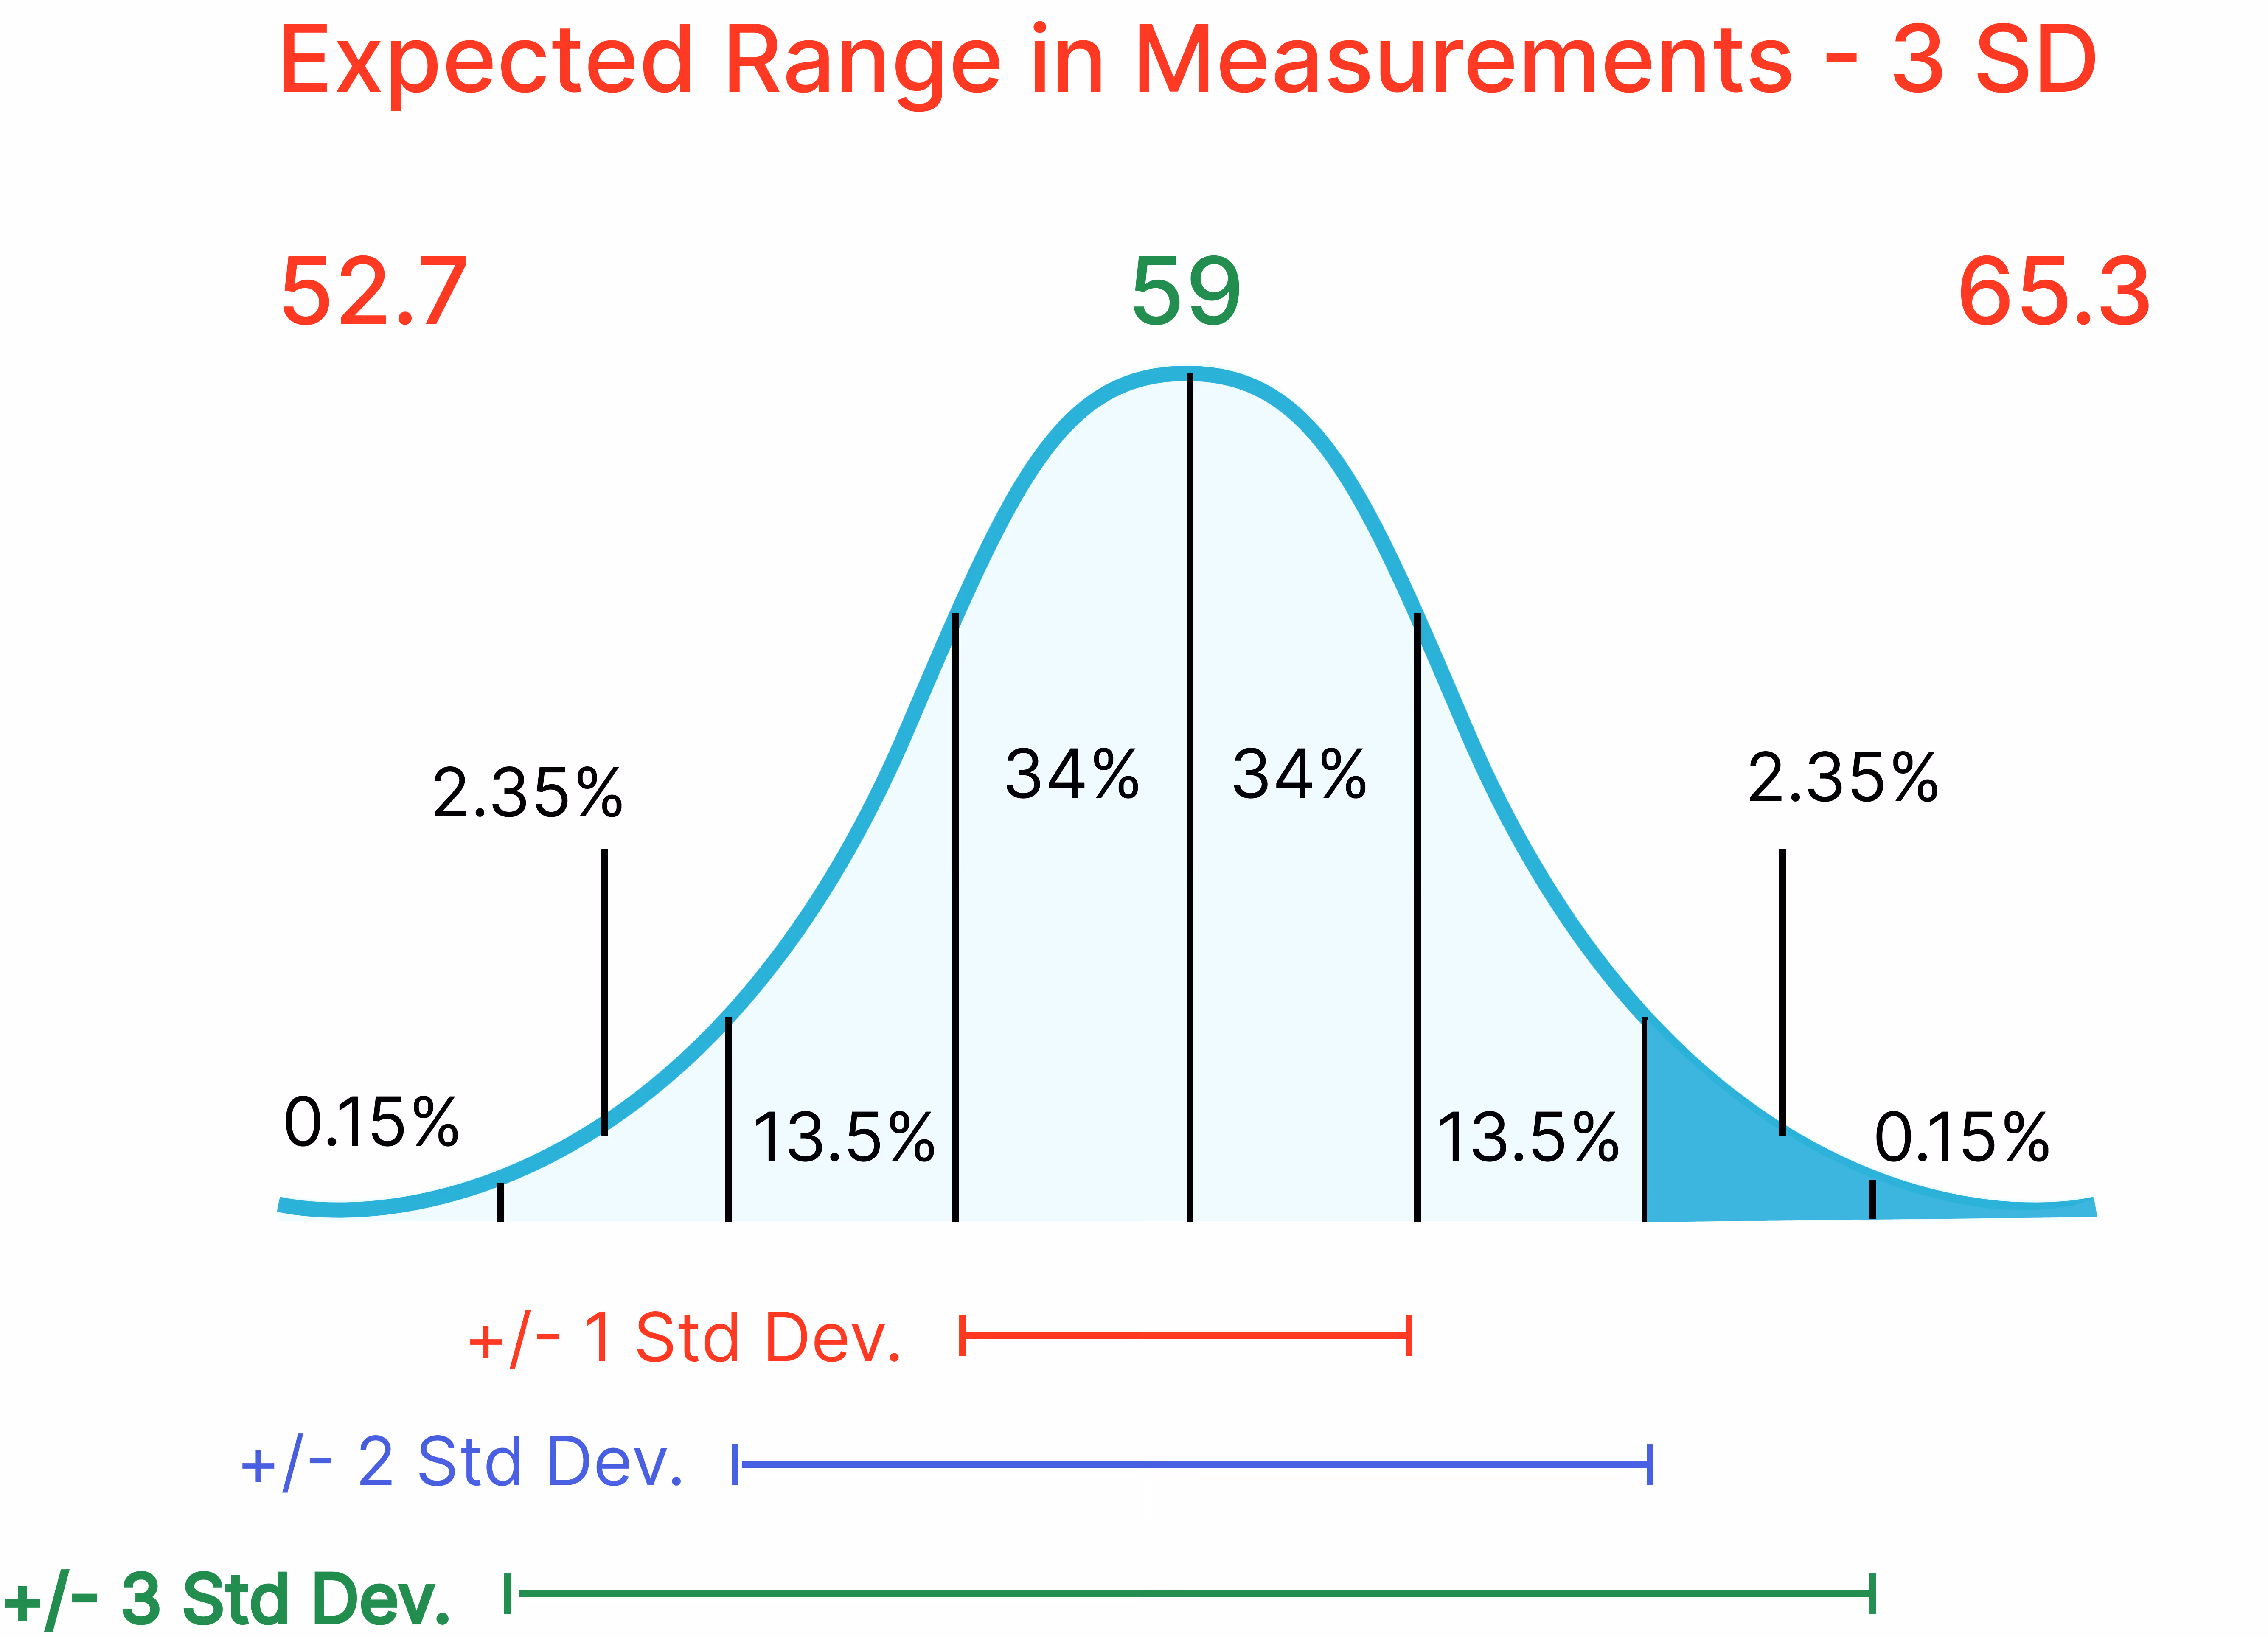
When they started measuring 100% of the products, they found that the average bun height was actually 59 mm, not a big deal - still well within the specification. But, they also found out that the variation was vastly different from what they thought. It was actually 2.1 mm! More than double compared to the limited manual sampling system. They had been sending too many unacceptable products to the customer, or did they just now have a better picture of the variation in their process.
Data from a random sampling plan - 36 buns per hour
Measurement
Bun Height
Mean = 60 mm
Standard Deviation = 0.9 mm
Data from 100% inspection - 45,000 buns per hour
Measurement
Bun Height
Mean = 59 mm
Standard Deviation = 2.1 mm
Yesterday before the on line 100% inspection system was turned on they were sending out the products to their customer and were not getting hardly any complaints on product height.Most of the very tall products and very short products were able to be removed from line by manual inspectors.
A Secondary Observation - Bake Color
Along with variation in bun height, they uncovered an issue with bake color. Because some buns were taller, they were closer to the heat source and baked up darker. The vision system data showed that the L values for bake color varied from 49.1 L to 56.3 L, a range of 7.2 L. Once the process change was made to reduce the variability in bun height, the variability in color also reduced by 3.3 L. After more refinements they were able to reduce the variability even further (approx 4.5 L).
How Can the Discrepancies be Explained?
When comparing manually sampled quality inspection data with results from an online 100% inspection system, discrepancies are not just common; they’re expected. These differences often reveal long-standing issues in sampling methods, measurement consistency, and data coverage. Before automated inspection, many food manufacturers relied on small, subjective samples that didn’t fully represent what happened during a production run. Let’s break down the main sources of this inconsistency:
Sampling Bias
- Were the samples truly randomly selected?
- What part of the line were they taken from?
- What side of the line?
- What part of the batch?
- Is an operator really going to pick a small bun or dark bun to measure?
Measurement Bias
- Were the measurement tools used in exactly the same way by all operators?
- Calipers on a soft bun – what pressure is applied by different operators?
- What is the peak height of a bun – e.g., seed or no seed?
Minimal Data Used
Before implementing the vision inspection system, they sampled only .08% of the product from the line, compared to 100% after it was implemented.
How to Effectively use the More Accurate and Representative Data?
Interpreting the data and reacting to the data in a productive way can include:
- Share the data with your production team in a positive way.
- Help them understand the range of variation in your process
- Help your customers set more realistic specifications based on true data instead of small data sets taken from hand picked samples
- Work with your production team to reduce the range of variation especially on the attributes that are seen as key by your customer
A Summary of the Key Advantages
When fully leveraged, the data collected by a vision inspection system delivers value far beyond the inspection itself, powering improvements in quality, safety, efficiency, and strategic decision-making across your entire operation. The key advantages for the food manufacturing and processing industry are:
- Improved Product Quality and Consistency
- Reduced Waste and Rework
- Faster, Smarter Decision-Making
- Support for Regulatory Compliance
- Mitigation of Costly Product Recalls
- Enhanced R&D and Innovation
- Scalable, Enterprise-Wide Insights
What’s Next: Evolving Role of AI and Machine Learning
The next frontier for vision systems in the food industry is not just inspection, it’s prediction, adaptation, and autonomous control. As artificial intelligence (AI) and machine learning (ML) technologies mature, food manufacturers are beginning to unlock new capabilities far beyond defect measurement and defect detection.
Smarter, More Adaptive Systems
Traditional vision systems rely on predefined rules to flag deviations, but AI-enabled systems can learn from data patterns and improve over time with exposure to real-world variability.
Predictive Insights and Autonomous Control
AI also opens the door to predictive quality, identifying problems in real-time before they occur. In this model, vision systems evolve from passive monitors to active participants in line performance, helping teams stay ahead of defects and maximize efficiency.
The Role of Data Infrastructure
To support AI at scale, manufacturers will need robust data infrastructure. KPM is already building platforms that combine vision, data, and intelligence, enabling manufacturers to benefit from AI without needing deep technical expertise in-house.
As AI evolves, vision inspection systems will become smarter, more predictive, and more autonomous, helping food producers shift from reactive quality control to proactive, data-driven manufacturing.
From Insight to Impact
Vision inspection systems have become far more than tools for catching visual defects; they are now critical sources of data, intelligence, and process control across the food industry. From ensuring product quality to supporting regulatory compliance, from reducing waste to enabling more innovative R&D, the data these systems generate empowers manufacturers to improve every part of their operation.
And, with AI and machine learning on the rise, the future of vision inspection is even more powerful, offering adaptive systems that not only see what’s happening on the line but help predict, prevent, and optimize in real time.
Ready to See the Full Picture?
At KPM Analytics, our vision inspection solutions, like the Q-Bake, P-Series, and SiftAI FM, deliver accuracy, speed, and the actionable data that food manufacturers need to thrive.
Whether you’re looking to:
- Replace manual sampling/inspection with 100% product monitoring
- Improve consistency across batches and shifts
- Detect and manage foreign materials more effectively
- Gain insights that drive long-term improvement
- Support digital traceability and compliance
…we’re here to help.
👉 Want to see how vision system data can transform your operations? Contact our team to learn how our vision solutions can be tailored to your process, products, and goals.
Yes, when measuring 100% of all products, a wealth of key production and productivity data such as: throughput/capacity %, defects % , uptime/downtime %, and changeover time.
Yes, we have interfaced to a variety of systems for real-time data collection and reporting. We also offer real-time process monitoring dashboards.
Yes, you can install multiple dashboards to monitor lines in real-time. All data from multiple lines and locations can be collected and packed together into detailed reports for enhanced production insights and compliance visibility.
Vision inspection systems can detect a variety of defects, including discoloration, foreign objects, missing pieces, and misshapen products.