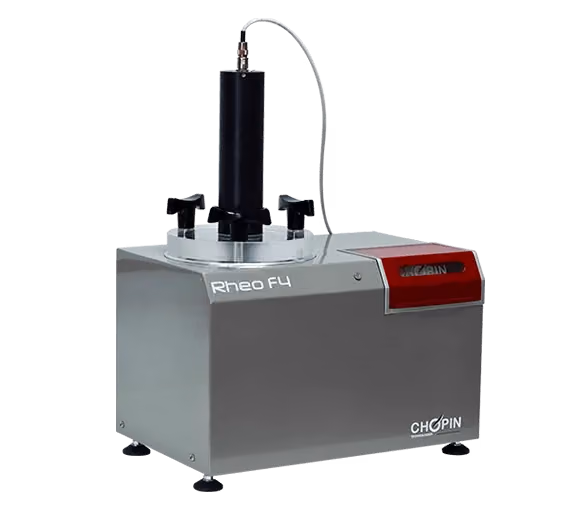
The Rheo F4 rheofermentometer is a one-of-a-kind instrument, uniquely capable of assessing both gas production and retention dynamics in dough, in a single test.
Understand Dough Behavior During Proofing
Rheo F4 measures all types of yeast dough for dough development, the production of gas due to yeast action, the porosity of the dough, and the tolerance of the dough during proofing – all in a single test. The Rheo F4 is the only analyzer that provides all the key measurements for understanding dough behavior during proofing.
Benefits
- Determine the optimum proofing and baking time, which helps reduce time and energy costs
- Fully automated testing: once the dough is prepared, the system will carry out the full analysis automatically, which frees staff to work on other tasks during the testing
- Collect comprehensive data from a single test and make decisions quickly about recipes and processes
- Monitor consistency in your production process to ensure high-quality end products
Features
- Automated testing for all types of yeast dough
- Measures development, gas production, porosity, and tolerance of dough in a single test
- Versatile analysis with the ability to customize the protocol
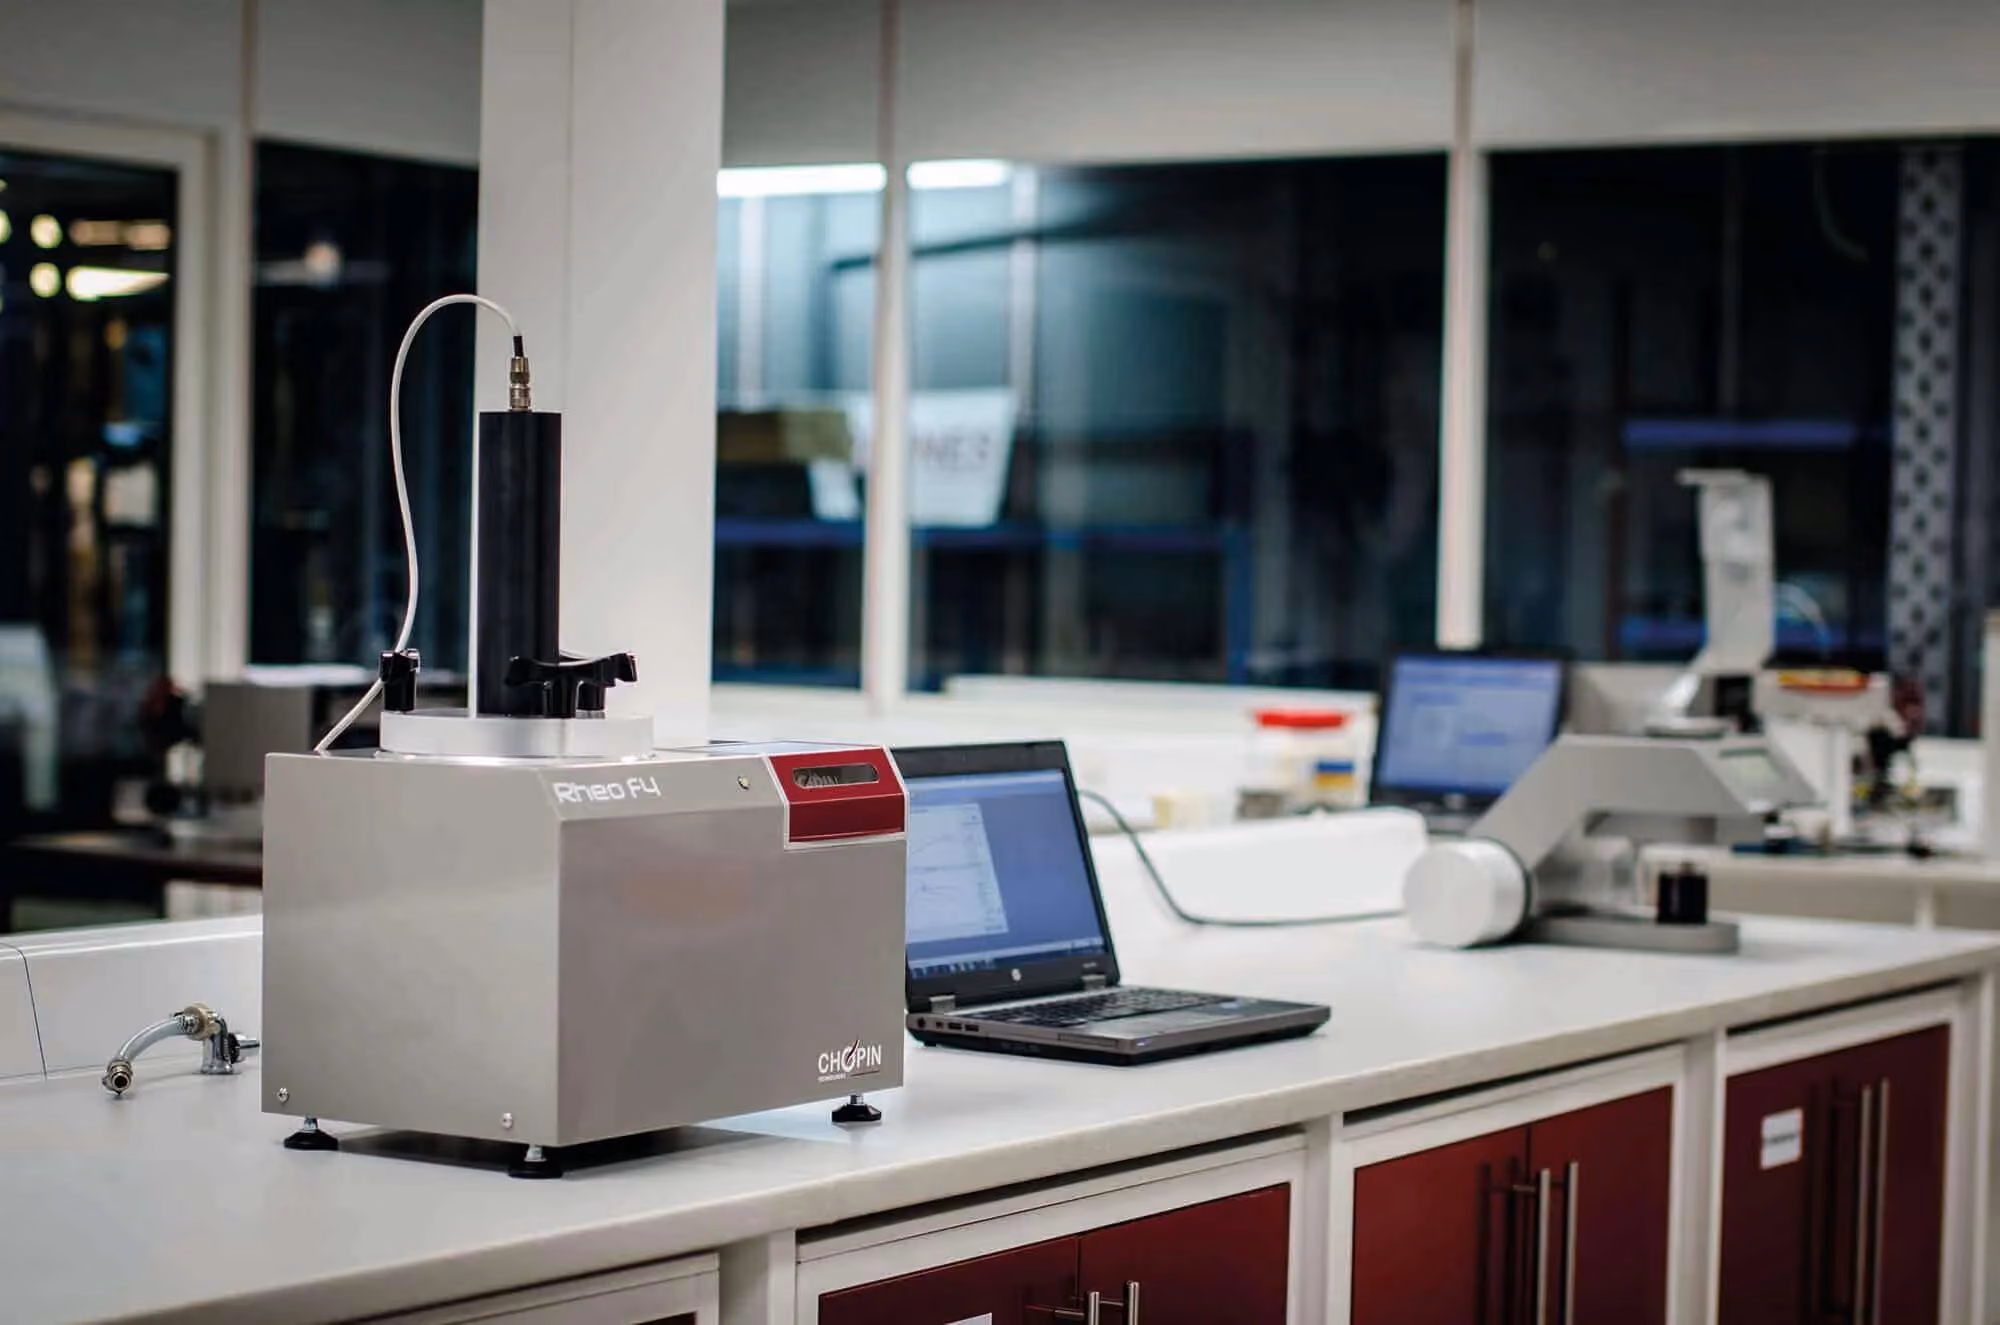
- Automated testing and monitoring through PC software
- Lightweight compact device that will fit into your laboratory with ease
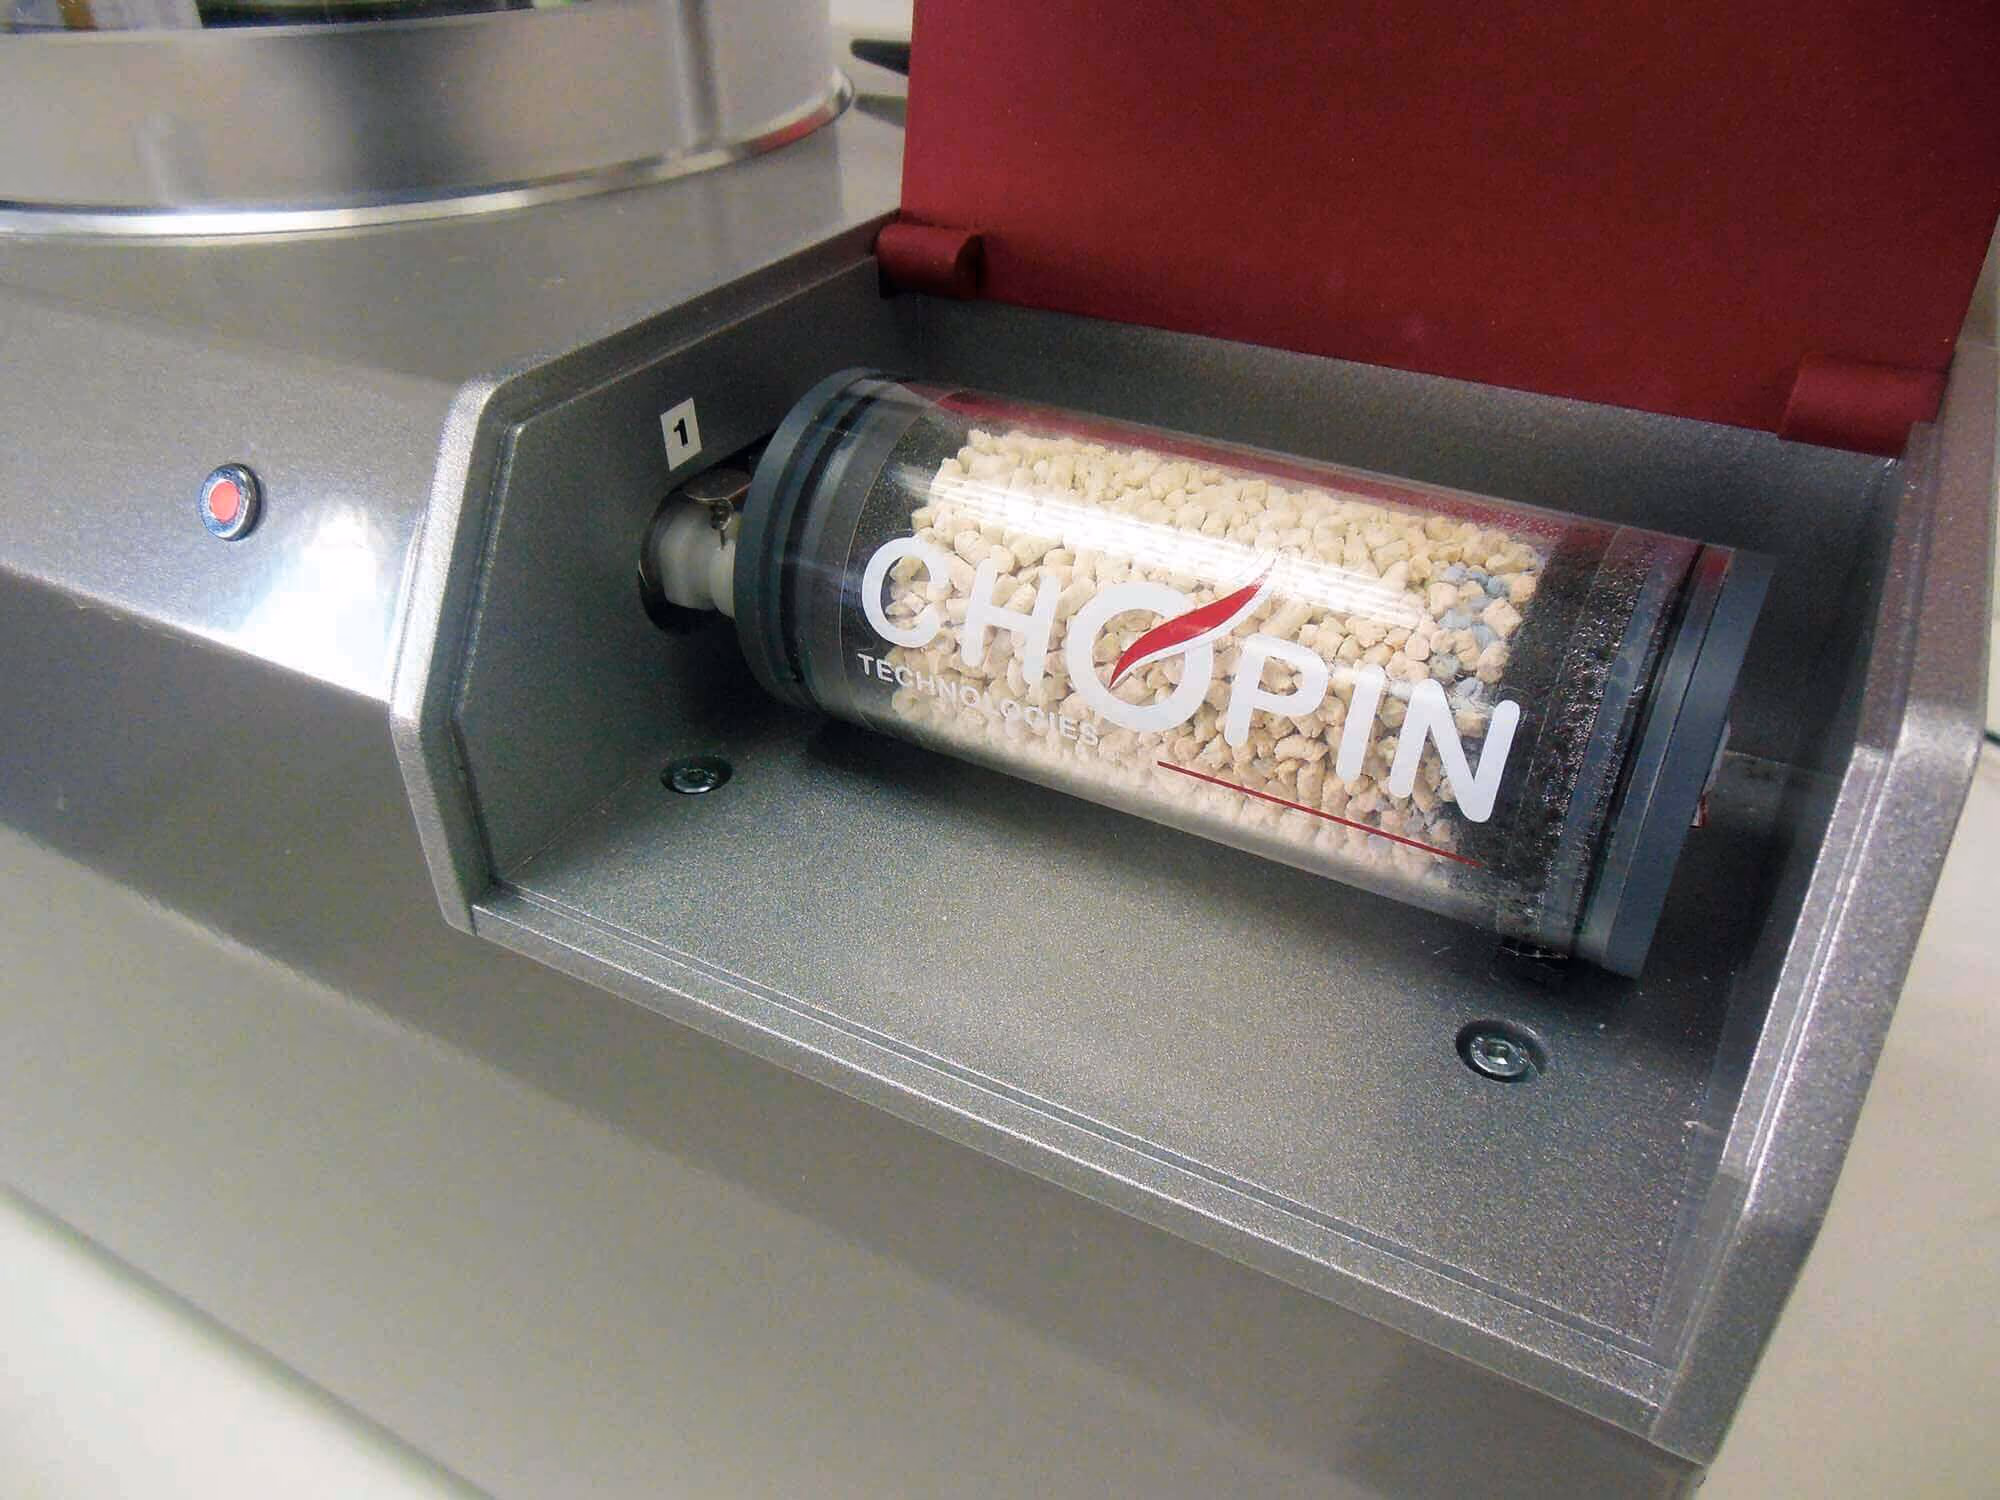
- Simple design, low maintenance, and a single consumable (soda lime)
Applications
An Indispensable Tool
Proofing stage plays a huge part in keeping end products consistent and it’s also a key evaluation step when developing new recipes.
The Rheo F4 can be used for a wide variety of applications:
- Analyzing ingredient selection and appropriate quantity to use for your recipes
- Monitoring the performance of an ingredient from batch to batch
- Measuring the impact of the water level on proofing properties
- Analyzing formulas containing sugar, fats, etc. including high fiber recipes and gluten free recipes
- Evaluating the impact of salt reduction, sugar reduction, etc.
- Analyzing durum wheat semolina
- Analyzing the proofing properties of frozen dough
- Analysis of the effects of additives such as cysteine, ascorbic acid, vitamins, etc.


Product Lineup
How It Works
Automated Testing And Monitoring
There are three main stages in the baking process – mixing/kneading, fermentation/proofing, and baking. Bakeries and their quality control teams need to ensure their entire process results in a high-quality, consistent end-product. Analyzing dough during mixing and final inspection after baking are common checkpoints, but what about that middle step? The fermentation or proofing process is a key functional step for ensuring the quality and consistency of the final product. Rheo F4 is designed for this key step.
Testing a dough sample using the Rheo F4 takes less than four hours – about 2 to 5 minutes of operator set-up time and 3 hours of automatic testing.
The Rheo F4 analyzer measures the pressure every 45 seconds in the thermostatically controlled, airtight tank that contains the dough. The device measures total gas production (yeast action) and gas retention (or porosity of the dough). A sensor in the top of the dough shows its development and stability so that the optimum baking time can be determined. Gas production depends on yeast, damaged starch, sugars, enzymes, etc. and gas retention mainly depends on the quality of the gluten network.

The test is easy to set up:
- Check that the soda lime cartridge is not saturated
- Prepare the dough and place it at the bottom of the basket
- Place the load weight on the piston
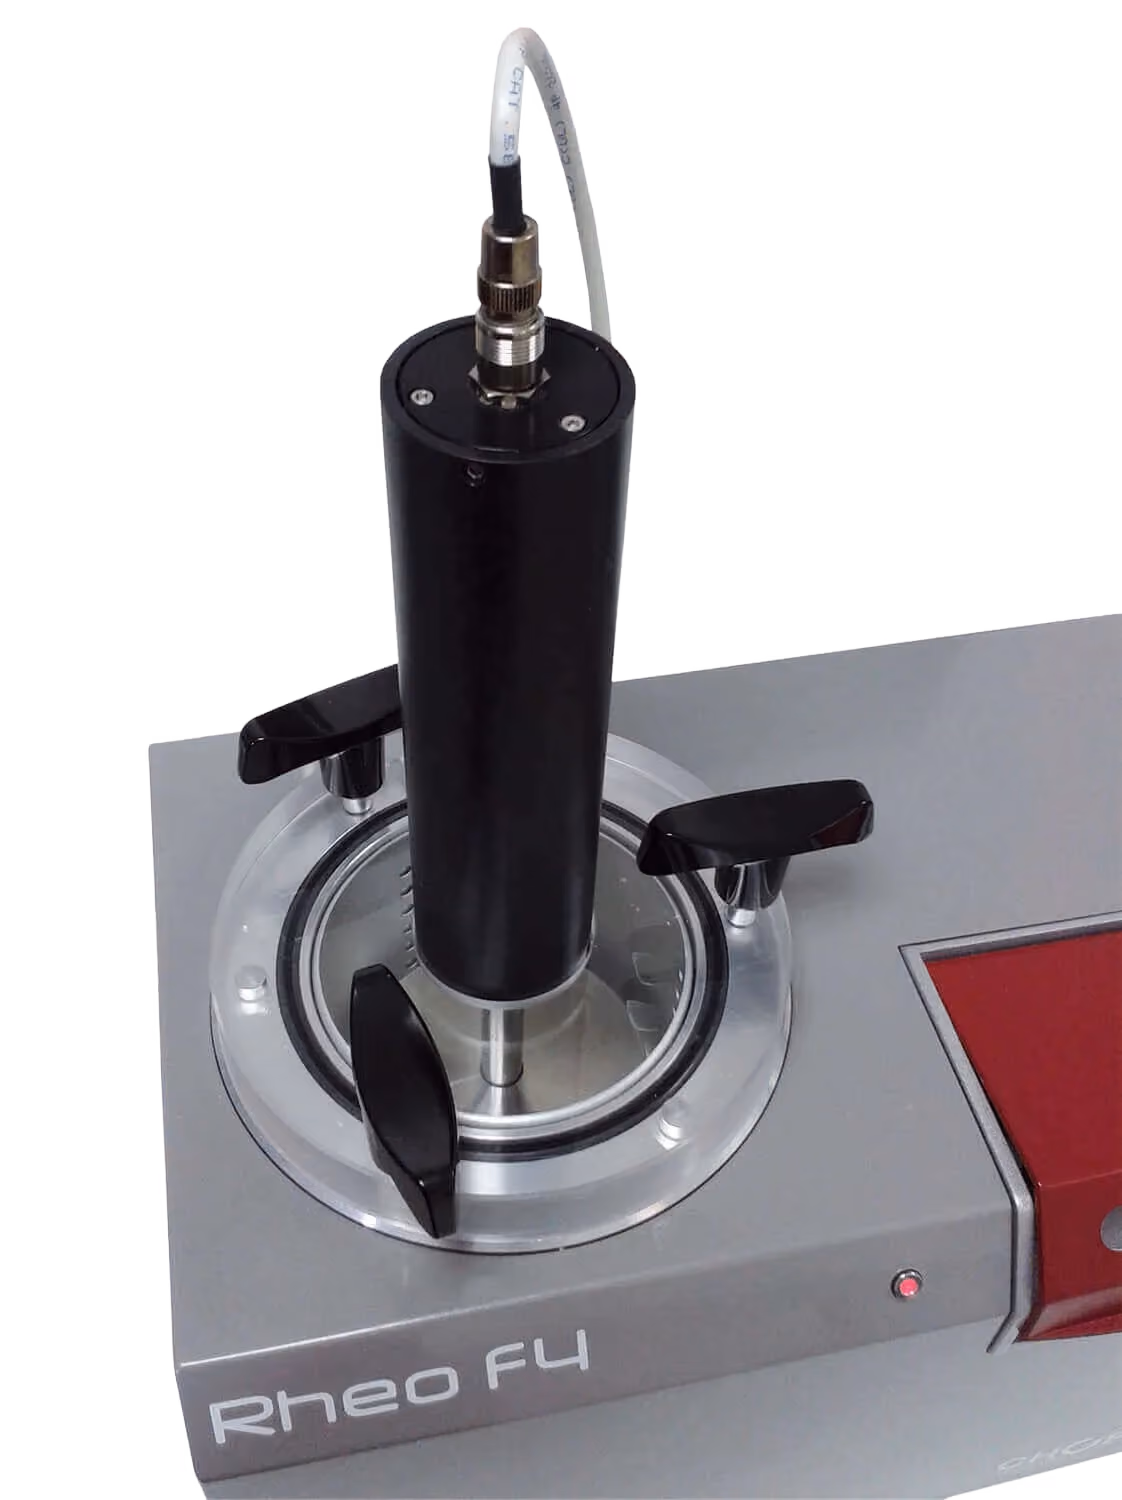
- Place the piston and the weights on the dough
- Place the development sensor and hermetically close the assembly
- Configure the test and press start

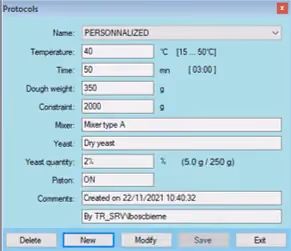
The Rheo F4 analyzes the development of the dough sample in the test bowl and the fermentation under the conditions imposed by the protocol used (temperature, piston, and weights placed on it, etc.). Testing protocols can be customized to analyze all types of yeast doughs and measurements of fermentation properties can be collected over periods of up to 24 hours. To learn more about yeast performance testing, read this article at Bakerpedia.
System Components
The Rheo F4 Proofing Bowl

Software
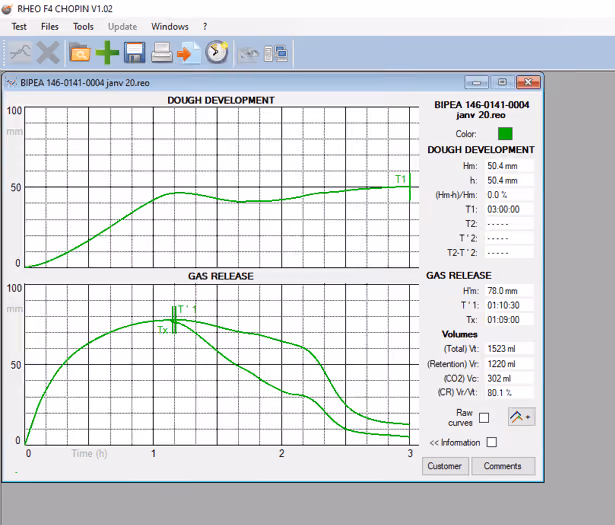
The user can monitor the Rheo F4 analysis during testing using PC software. Every 10 minutes during the testing, the curve is actualized and displayed for the user. All calculations are provided at the completion of the testing. The data from several samples can be compared to determine product conformity and to precisely evaluate the effect of an ingredient on the dough.
Two main charts are produced for evaluation – one with a dough development curve and the other with a gas production and a gas retention curve. To get a complete image of dough proofing properties, these 3 curves need to be considered together.
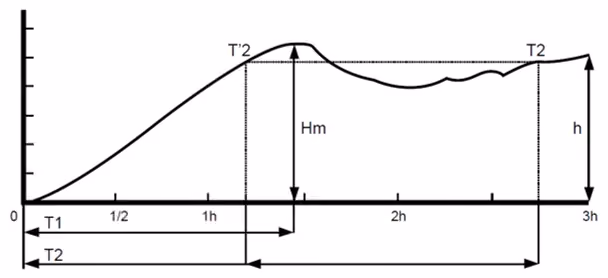
Development Curve
The dough development curve is obtained by measurements taken at regular intervals by the dough development sensor. The measurement and combination of the values obtained with the development curve provide essential information for dough quality assessment. Time (T1) is very closely linked to yeast "speed" and activity. Height (Hm) corresponds to the maximum development reached by the dough and is linked to bread volume. (Hm-h)/Hm corresponds to the drop in development after 3 hours (as in the case of the CHOPIN protocol) and is a good indicator of dough tolerance during proofing.
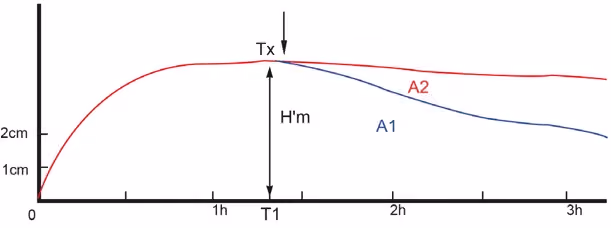
Gas Curve
To plot the gas release curve, the pneumatic circuit runs pressure measurement cycles. These pressure measurements are converted into flow rates by the microprocessor. The gas production curve enables the user to determine the retention coefficient (R), which is the comparison in % between the volume retained within the dough and the total volume of gas produced during the test.
Example: R is very close to 100 with the flours extracted from healthy grain almonds. It may drop to 50 for flours derived from the outer layers of the endosperm (end of grinding or reduction in the milling diagram) or for flours extracted from damaged or poorly stored grains.
Example: R is very close to 100 with the flours extracted from healthy grain almonds. It may drop to 50 for flours derived from the outer layers of the endosperm (end of grinding or reduction in the milling diagram) or for flours extracted from damaged or poorly stored grains.
Other Values Provided By The Graph
- Maximum height of the curve (H’m)
- Time required to reach H’m (T1)
- Time when the dough begins to give off CO2 (Tx)
- Total volume of gas given off in ml
- Total volume of CO2 lost (A2)
- Volume of CO2 in ml retained within the dough at the end of the test (A1)
Testing results are backed up automatically and can be printed in the form of a customizable analysis certificate.


Accessories
Available Accessories
- Flour Reference Sample for performance checking
- Optional EM10 Multi-Compartment Oven for reference measurement of the moisture content of wheat, flour, and any other cereal
Specifications
Rheo F4
Frequently Asked Questions
It is possible to analyze the proofing properties of frozen dough with the Rheo F4. The device evaluates how freezing cycles affect dough by measuring gas production and retention parameters. Frozen dough typically shows lower gas production and development than fresh dough, and the Rheo F4 can precisely quantify these differences. This makes it a valuable tool for optimizing recipes and improving the performance of frozen dough formulations
Determining the optimum proofing and baking times reduces unnecessary testing cycles and energy consumption during production.
Resources