The Mixolab Series, comprised of the Mixolab 200 and Mixolab 300, is the next generation in flour and dough quality analysis. Unlike other rheological instruments, it is a fully automated tool that simulates the baking process, including mixing, heating, and cooling, to assess the functional interactions of starch, proteins, enzymes, and other components.
Meet the Challenges Facing Today’s Wheat-Flour-Bread Quality Control Process
The Mixolab Series is the latest in the lineage of internationally standardized flour and dough rheological analysis technologies. It simulates what happens when flour is mixed into a dough and is heated and cooled, allowing users to get as close as possible to how the flour will adapt to unique baking processes. The Mixolab Series measures the consistency of dough and analyzes the quality of the protein and starch.
With the Mixolab Series, bakers and millers can check the quality and regularity of their flours, assess the impact of enzymes, and develop new formulations such as those rich in fiber and gluten-free, to ensure smooth production processes and equality of finished products. And now, with Mixolab 300, users have the unique capability to turn their Mixolab into a simple lab or at-line instrument to analyze dough samples at various production stages, helping them make informed process decisions.
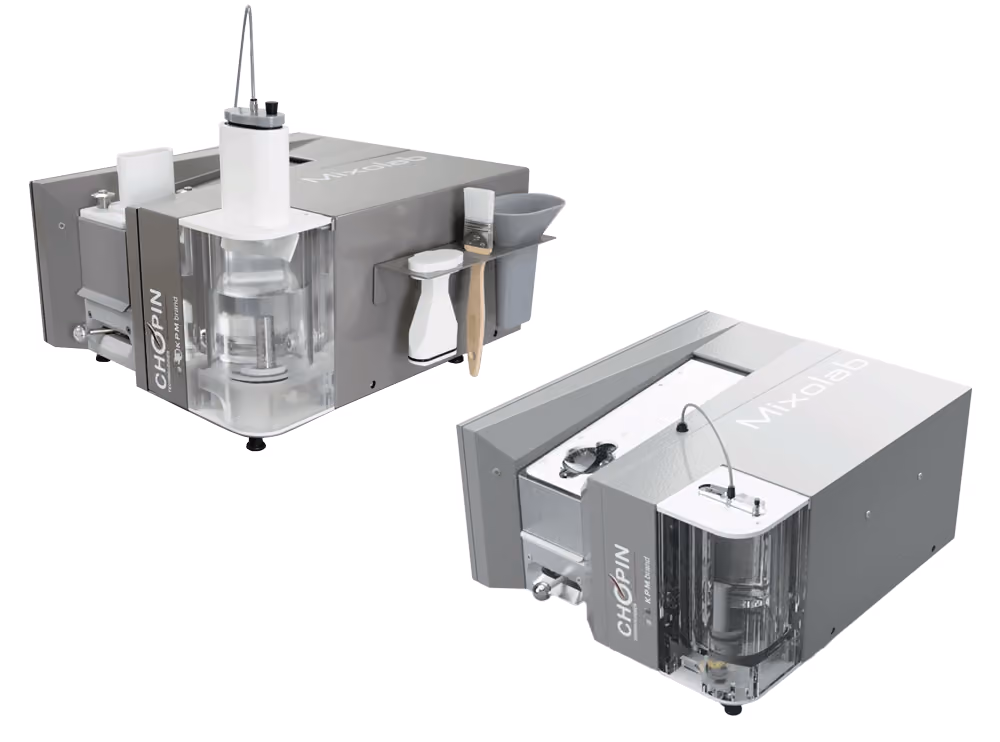
Mixolab Series Options
| Mixolab 200 | Mixolab 300 |
|---|---|
 |
 |
| Mixolab 200: Comprehensive flour and ingredient analysis for quality control and research applications. | Mixolab 300: Combines flour and dough analysis into a single simple solution for lab or at-line use. |
| Note: Mixolab 200 can be upgraded to the Mixolab 300 seamlessly with an upgrade kit, which introduces applications for at-line dough analysis. | |
Benefits
- Provides a clear comprehensive overview of flour quality and dough properties.
- Improves operators' productivity, repeatability and control thanks to the automated test and the comprehensive, and intuitive MixoPRO software.
- Customize specifications and protocols according to your specific process.
- Analyze dough with various ingredients as well as complete formulas (Mixolab 300 only).
Features
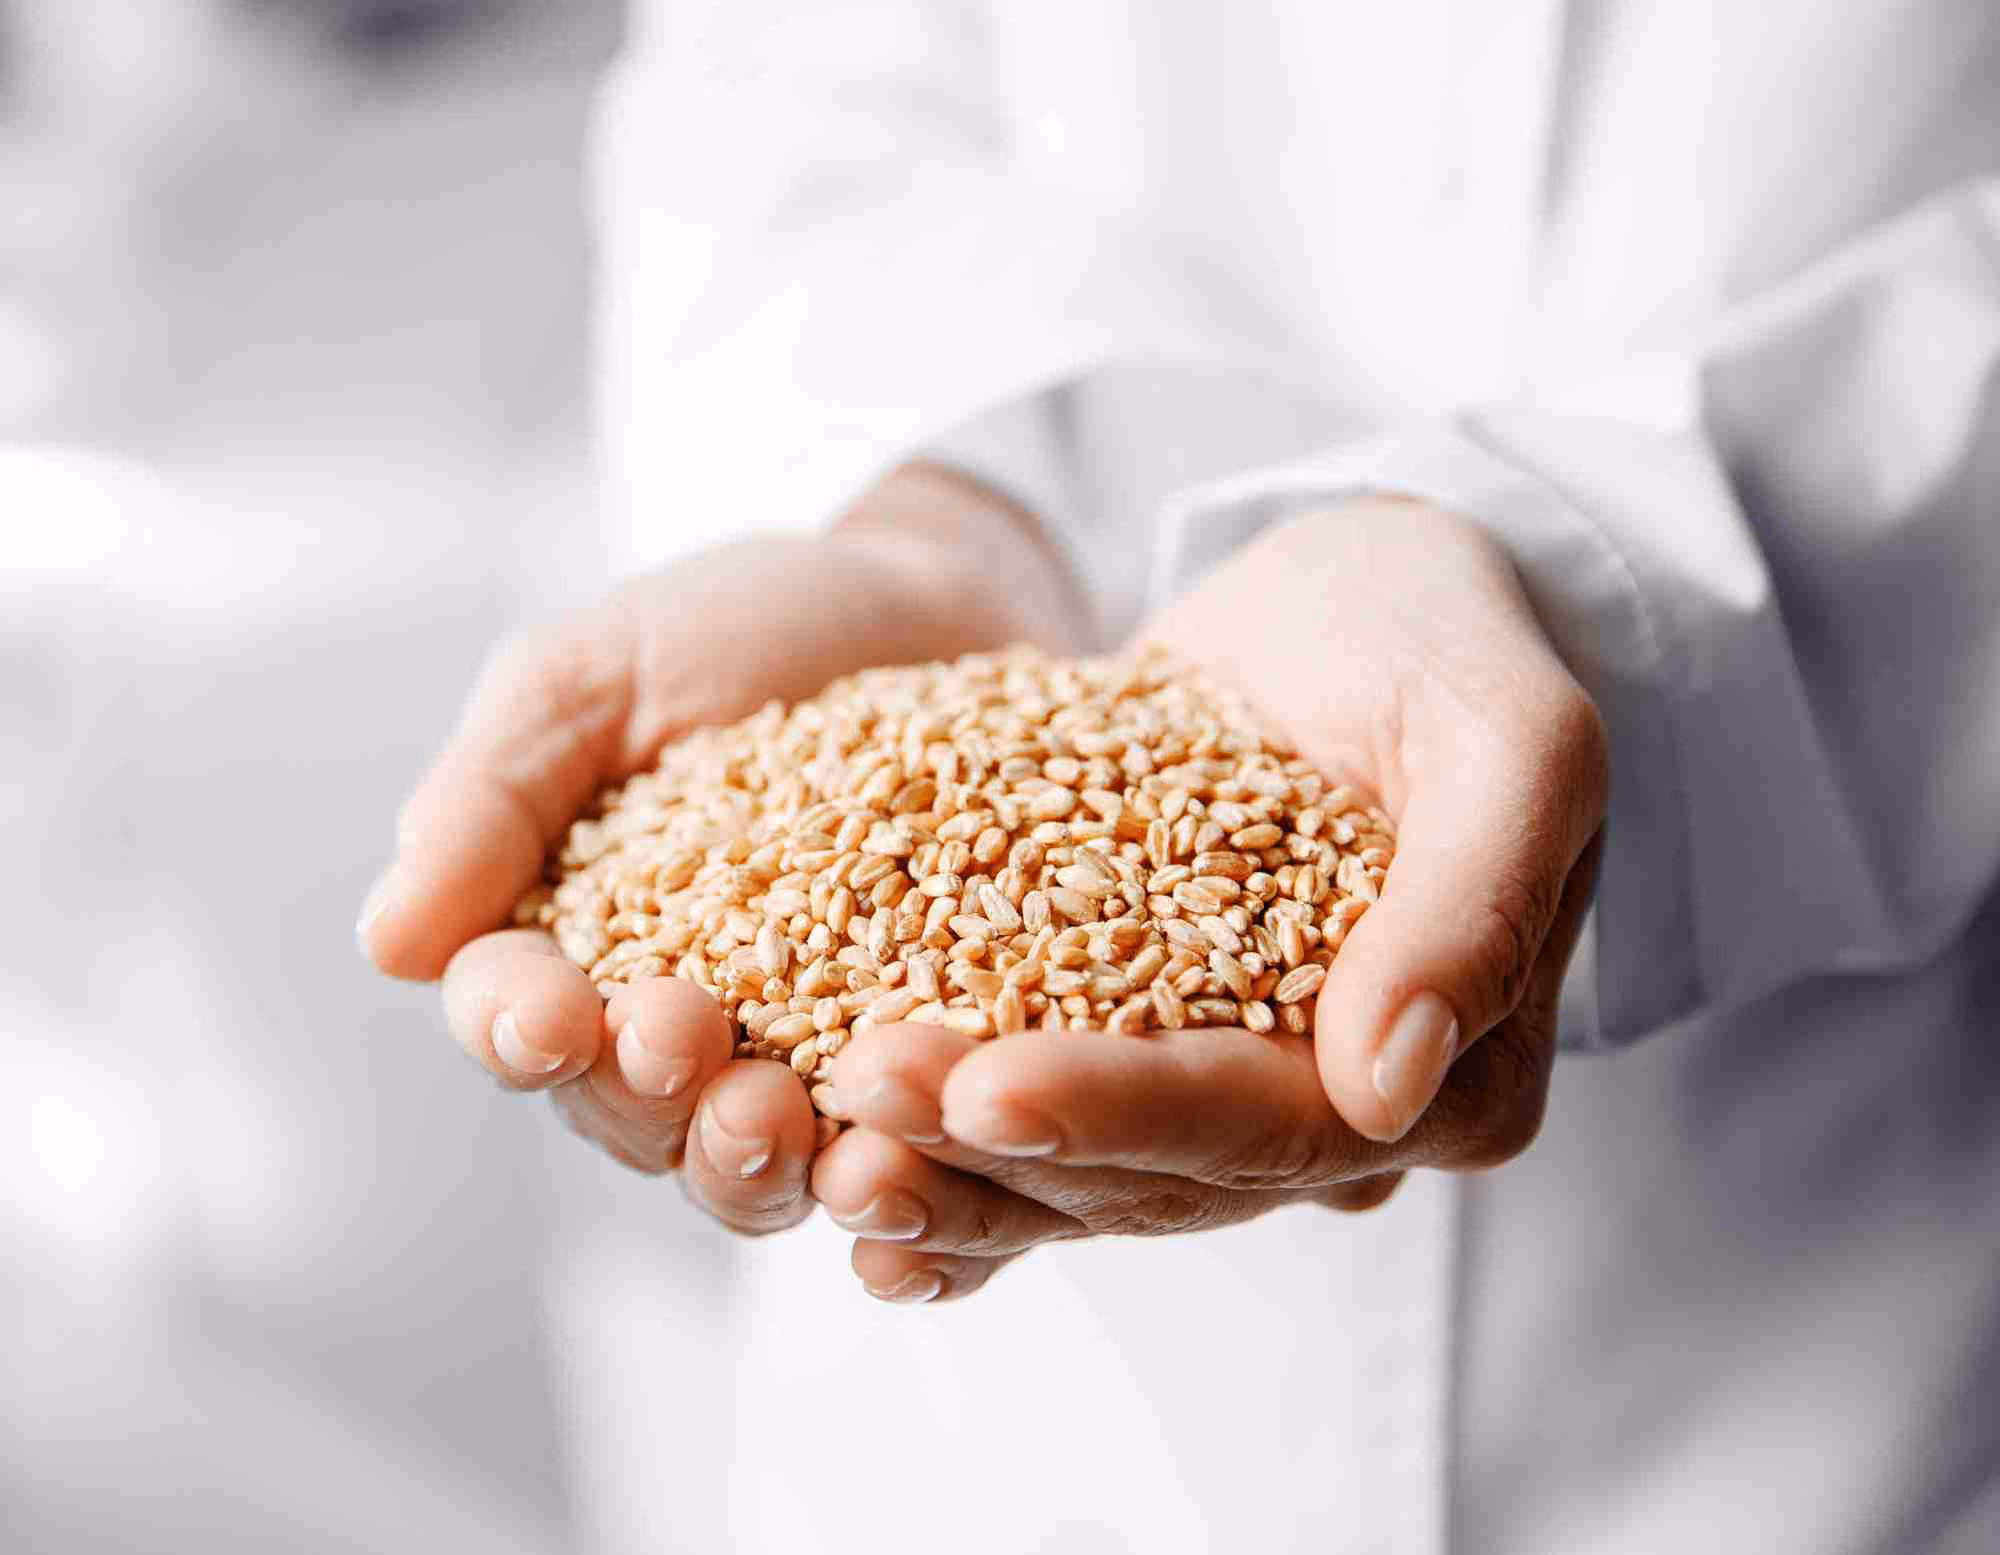
- Test all raw materials (wheat, rice, corn and more) and doughs (including batter and liquid doughs (Mixolab 300 only))
- Multiple built-in test protocols, with the capability to customize protocols for different flours and baking processes.
- Optional test protocol provides equivalent Farinograph® data (values and units) comparable with existing Farinograph® equipment but with a much smaller sample size.
- Seamless upgrade to the Mixolab 300 Flour & Dough Analyzer
- Compliant with international standards: ISO 17718:2013, AACC 54-60.01, ICC 173-1, GOST R54498-2011 and GOST R ISO 17718-2015.
Applications
The Mixolab Series provides solutions for many professionals in the cereal industry. Below are the most common applications. However, many other professionals use the Mixolab Series for multiple applications: leaveners, research centers, R&D labs, and more.
For Bakers:
- Verify the conformity of delivered flours and their performance.
- Test dough samples at-line to validate flour quality and process performance (Mixolab 300 only).
- Identify potential production issues in advance.
- Study the rheological behavior of fiber-rich flours and whole-wheat formulas.
- Facilitate the elaboration of gluten-free products.
- Assess the impact of various additives and ingredients (salt, sugar, fat, etc.).
For Ingredient Manufacturers:
- Study the impact of ingredients under real-world recipe and baking conditions
- Develop and validate new ingredient solutions (whole grain, gluten-free, etc.) quickly and objectively.
- Anticipate ingredient performance across different baking processes.
For Millers:
- Wheat testing at point of delivery.
- Detection of pest-infestation of wheat.
- Optimize wheat and flour blend.
- Adapt flours for customers through precise additive application.
- Compare products from different flour mill streams.
- Analyze impact of damaged starch.
For Recipe Research & Development:
- Simulate the entire baking process, helping facilitate product development and research.
- Apply objective data to manual touch and observation, helping instill stronger quality control standards.


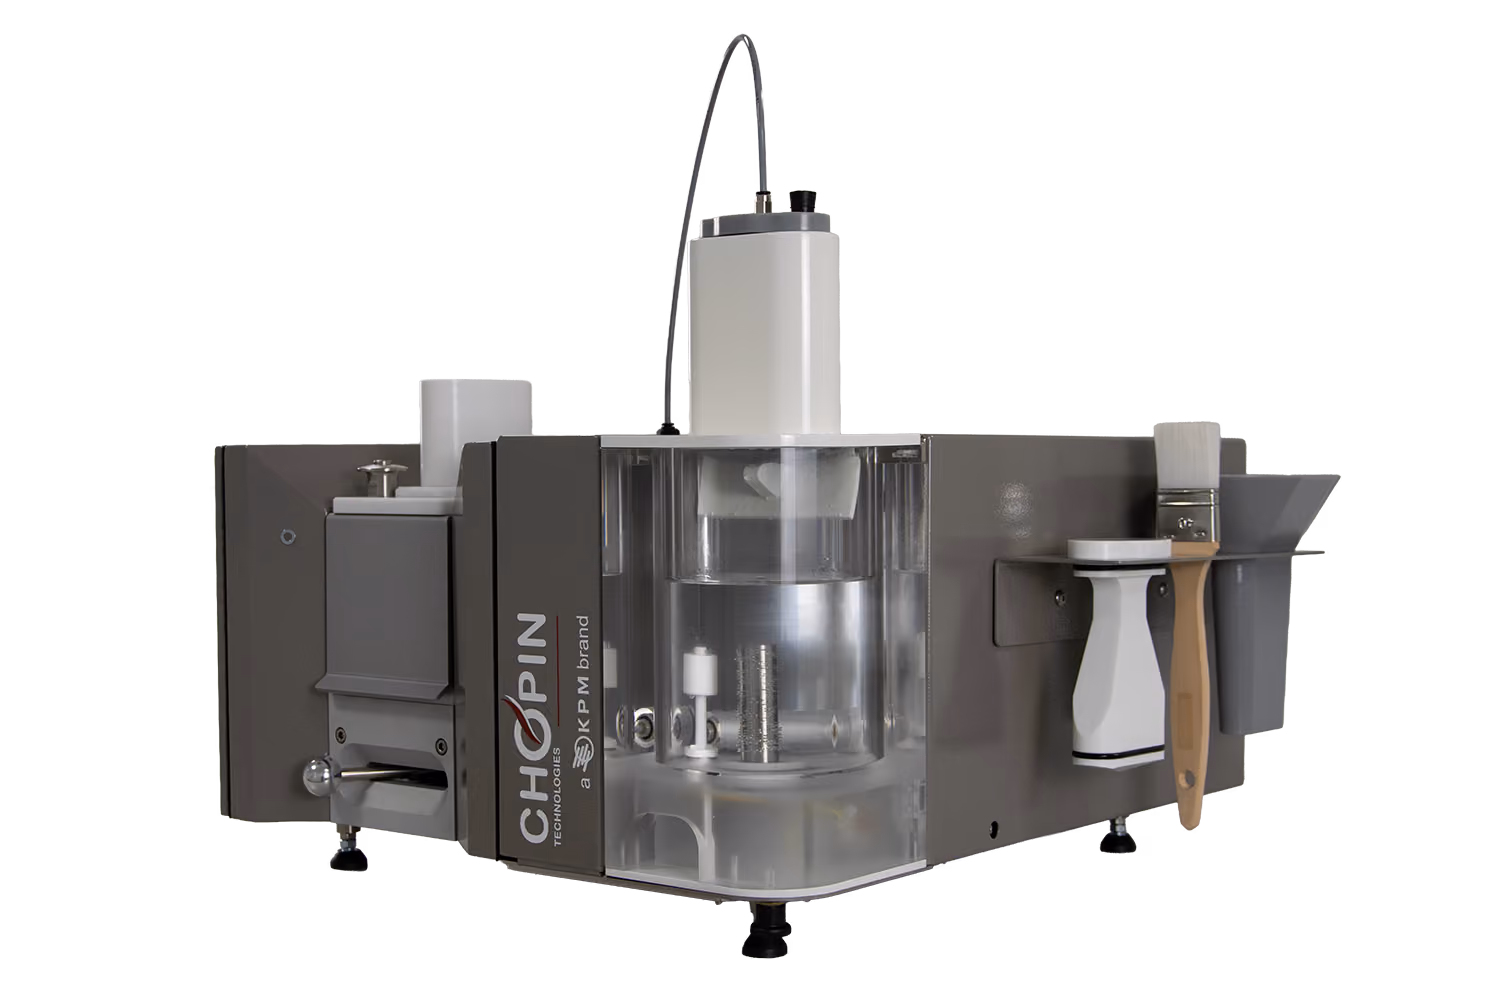
Product Lineup
How It Works
Fully Automated Analysis of Complex Flour Compositions
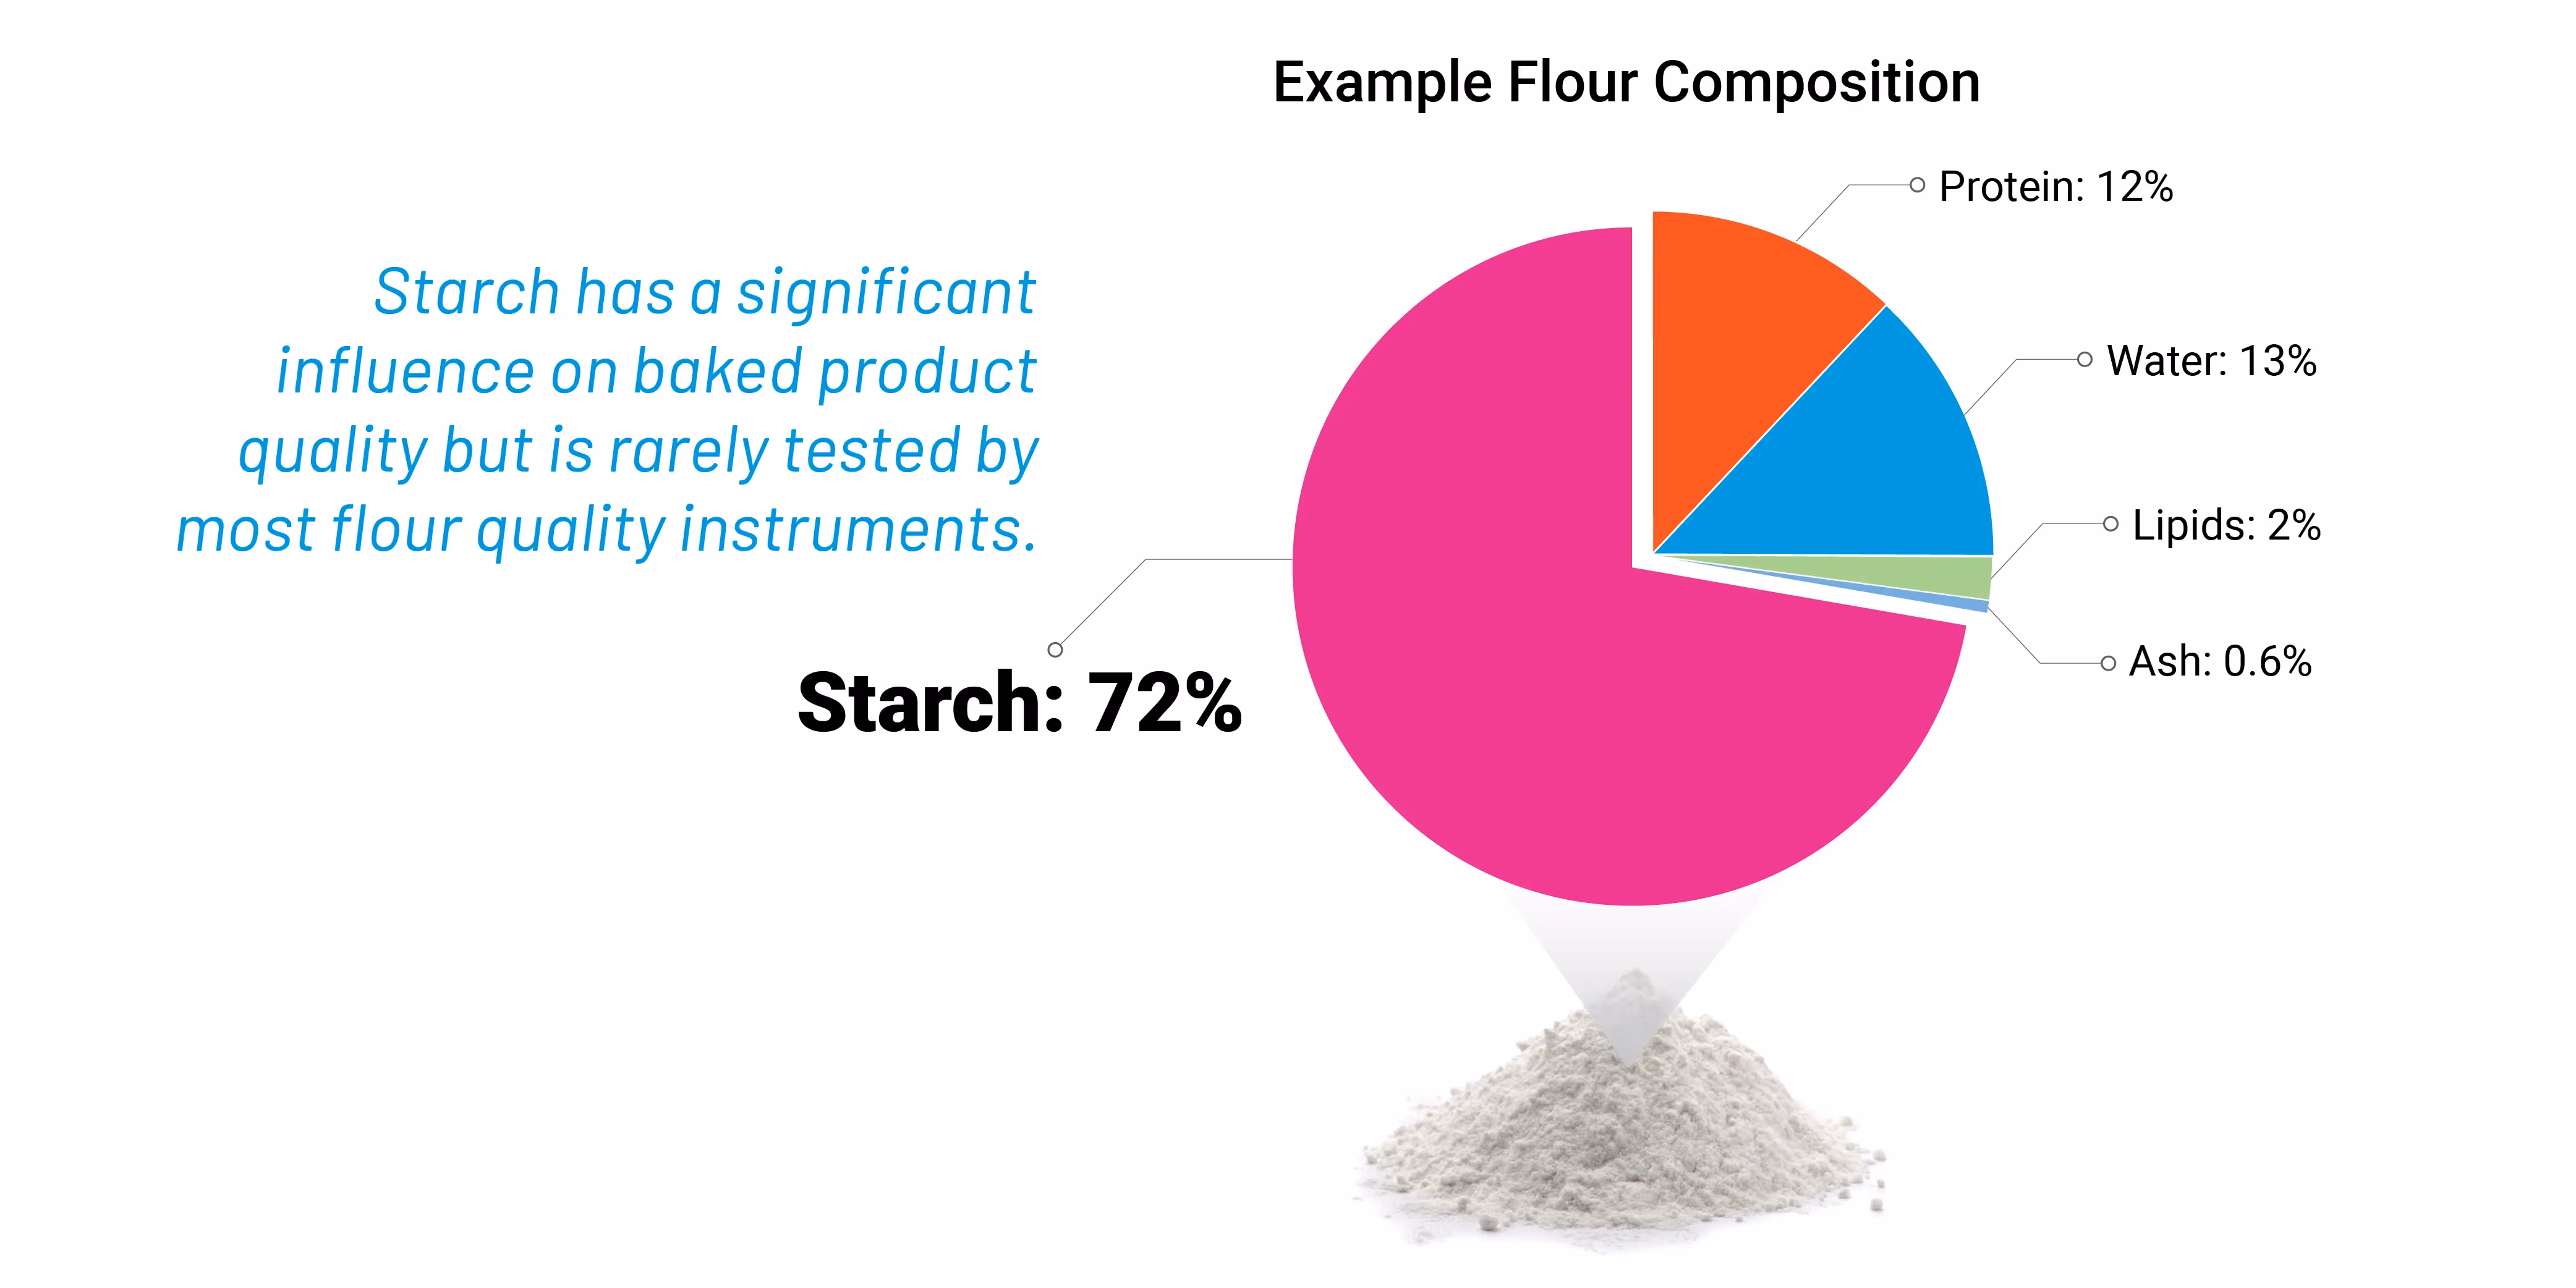
While many of today’s flour quality specifications emphasize protein, and in particular gluten, many bakers still face process issues despite using flours assessed and approved based on protein characteristics. While protein plays a critical role, starch – the most available component in wheat flour – is often ignored in most quality specifications.
The Mixolab Series considers the entire flour composition in addition to protein, including starch, enzymes, and other components. This fact puts the Mixolab Series into its own category compared to other rheological instruments.
Both Mixolab 200 and Mixolab 300 provide a comprehensive picture of dough behavior during the baking process in a single test.
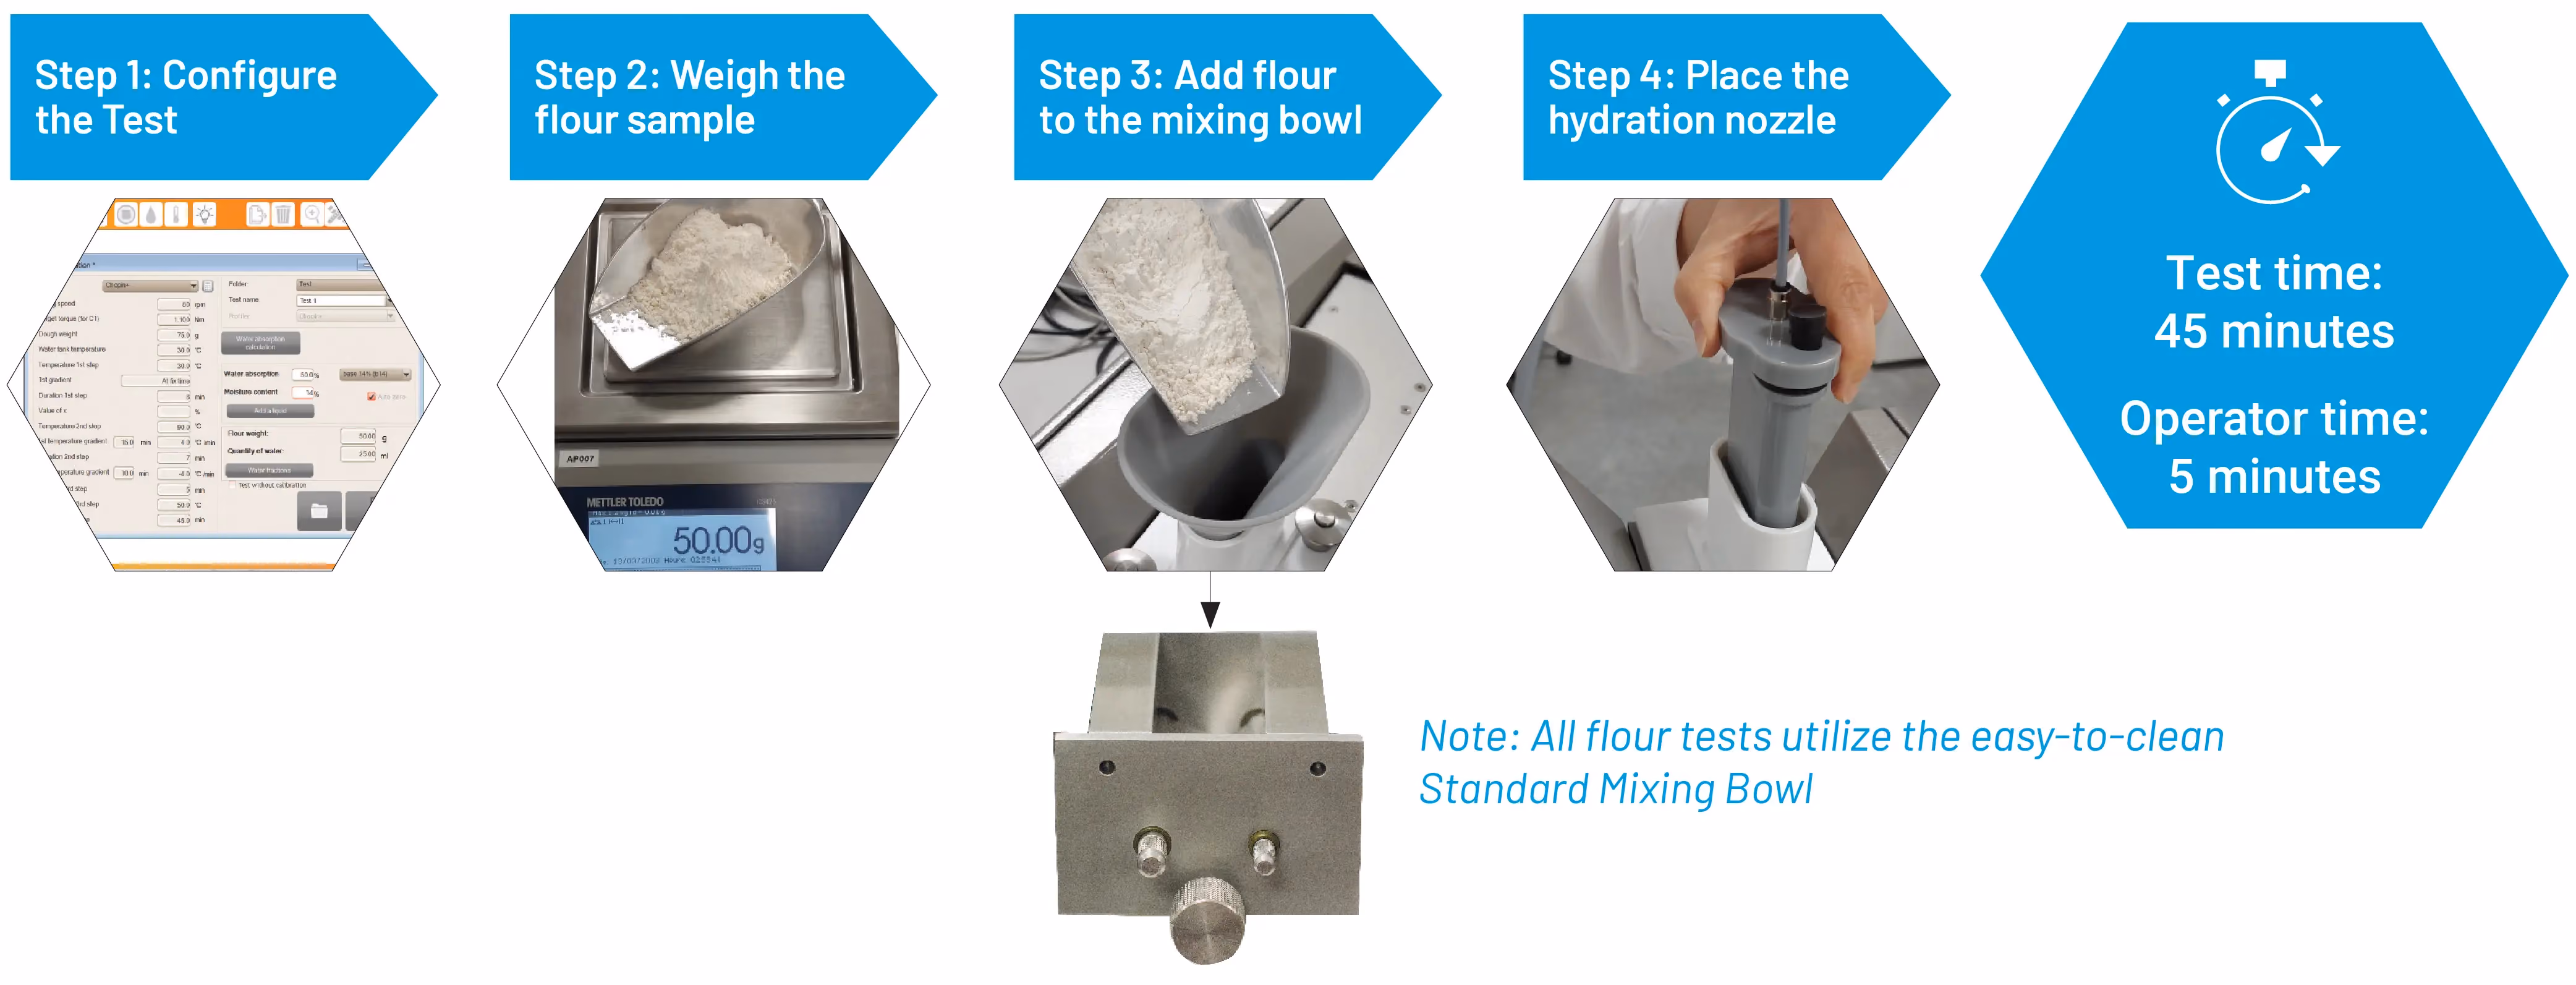
Flour Testing Process (Mixolab 200 and Mixolab 300)
Make At-Line Dough Checks Objective, Accurate, and Repeatable
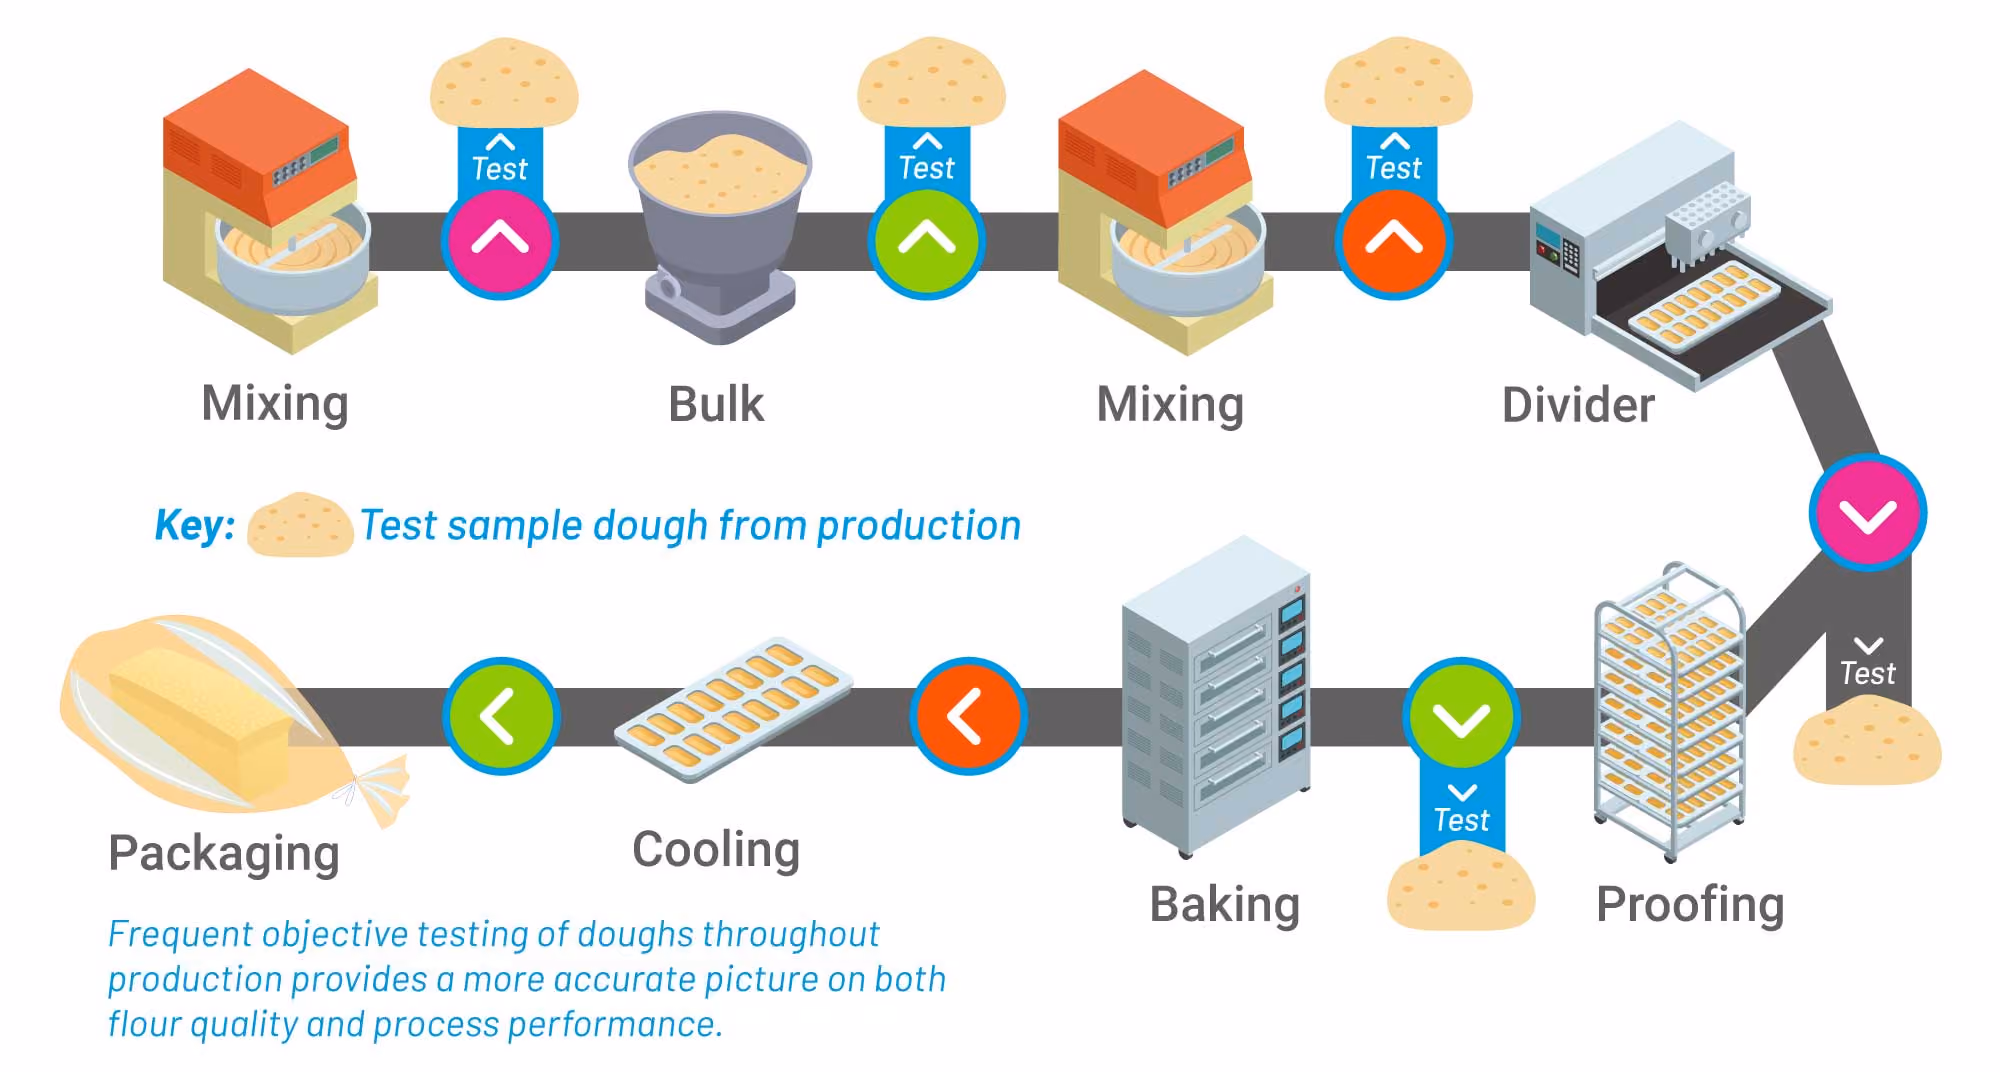
Dough behavior changes significantly throughout the process. Still, most bakeries rely on visual or manual assessment of doughs, a subjective and imprecise method that is operator-dependent. This method is becoming more problematic as many baking experts are leaving the industry, and training new baking operators can take years.
Common Baking Process Stages for At-Line Dough Testing
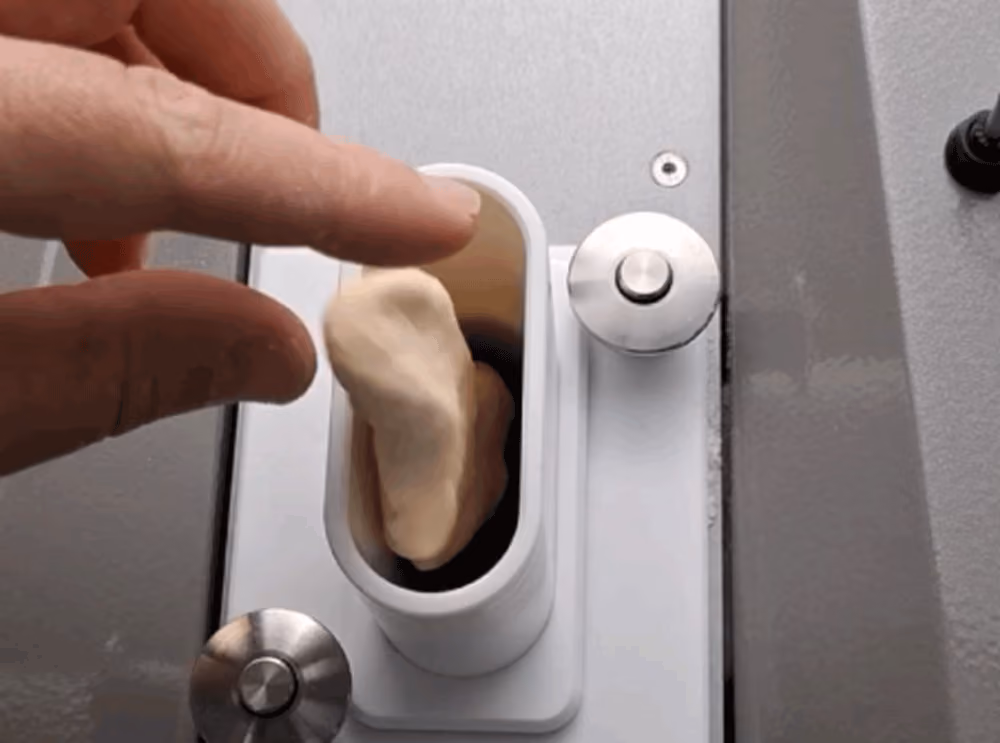
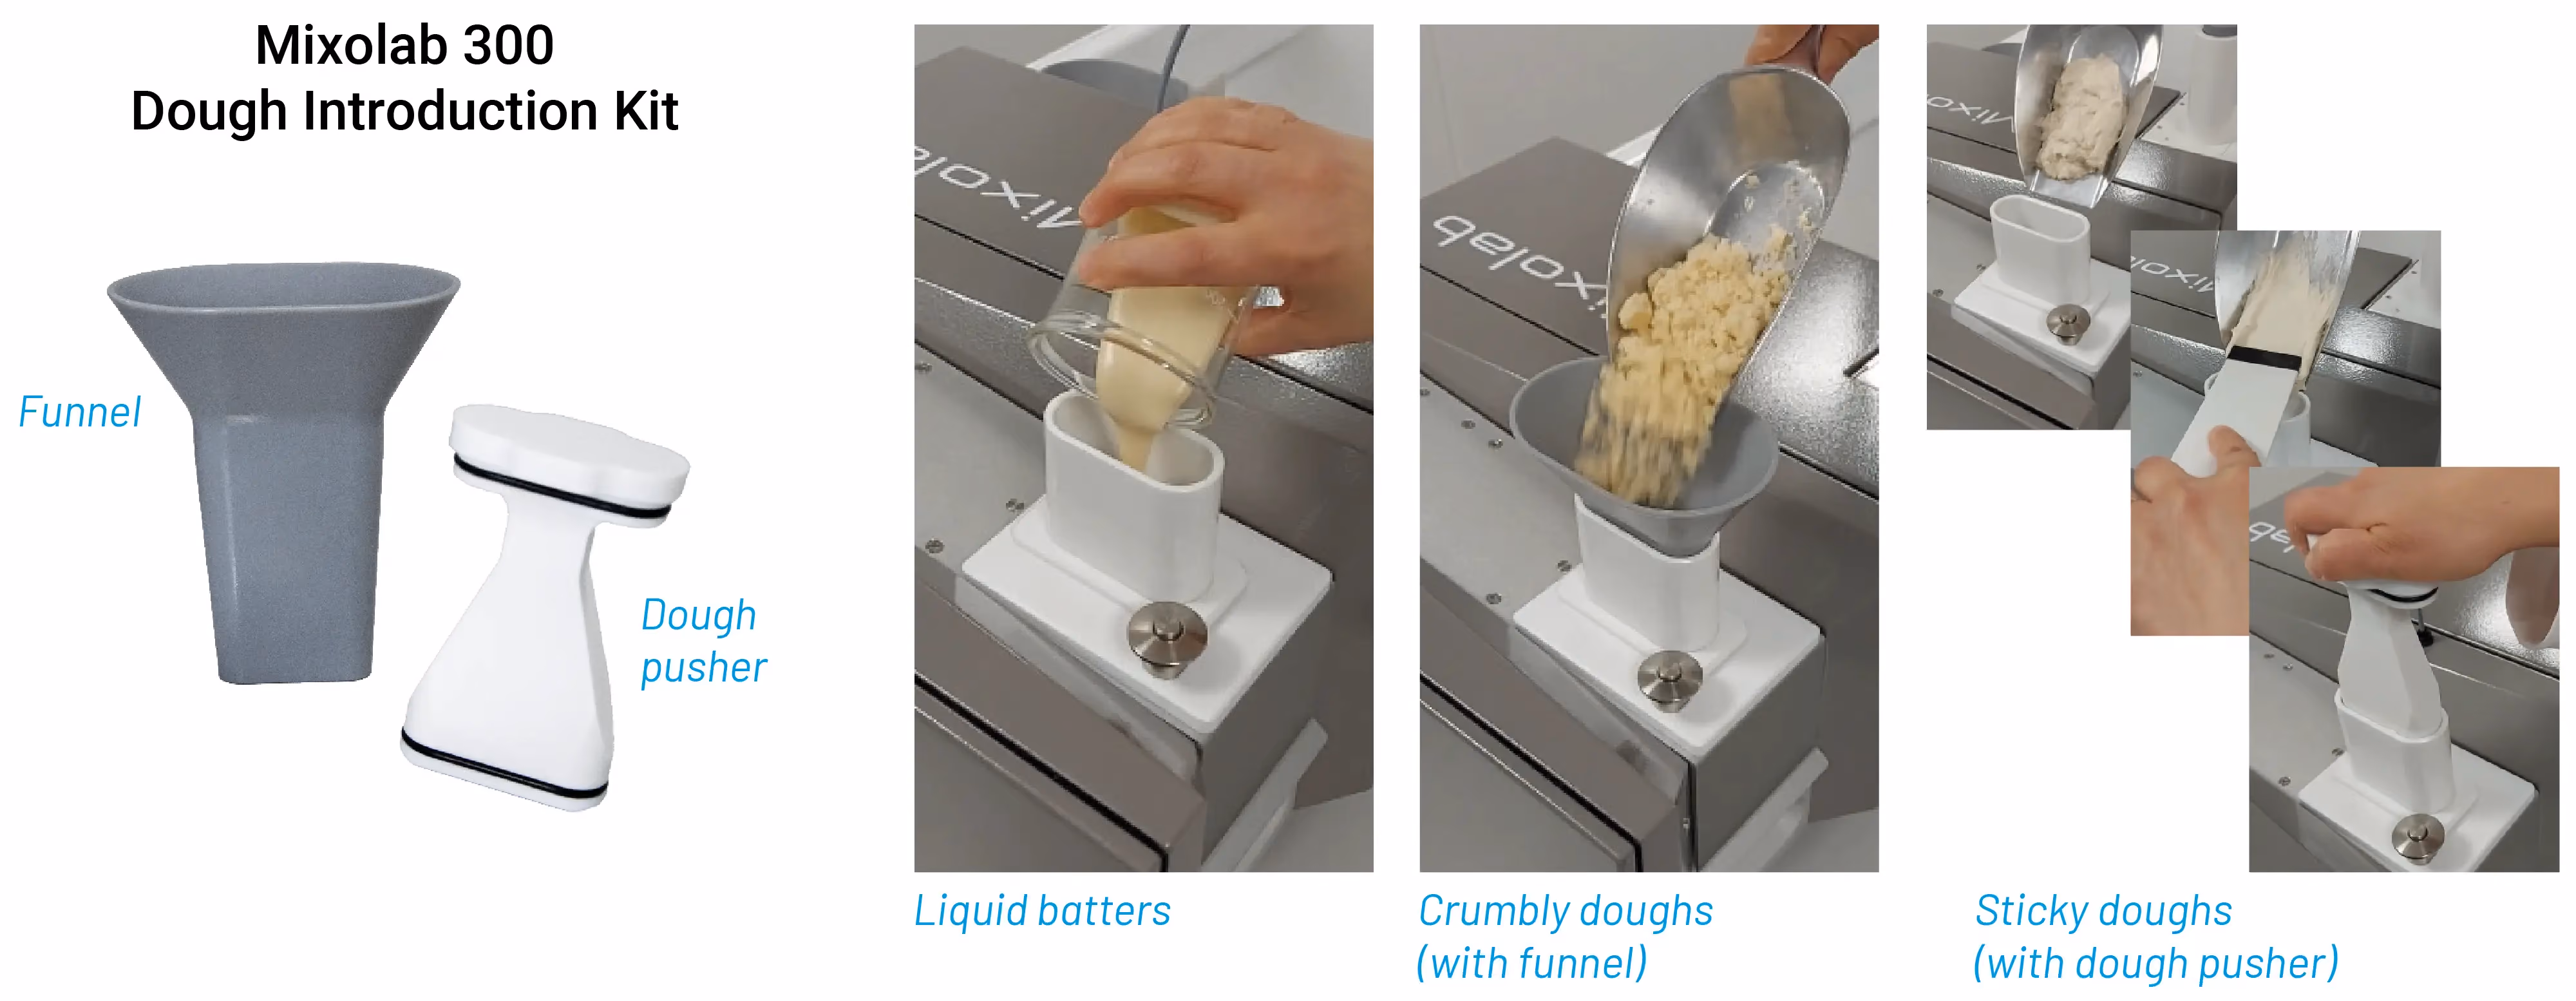
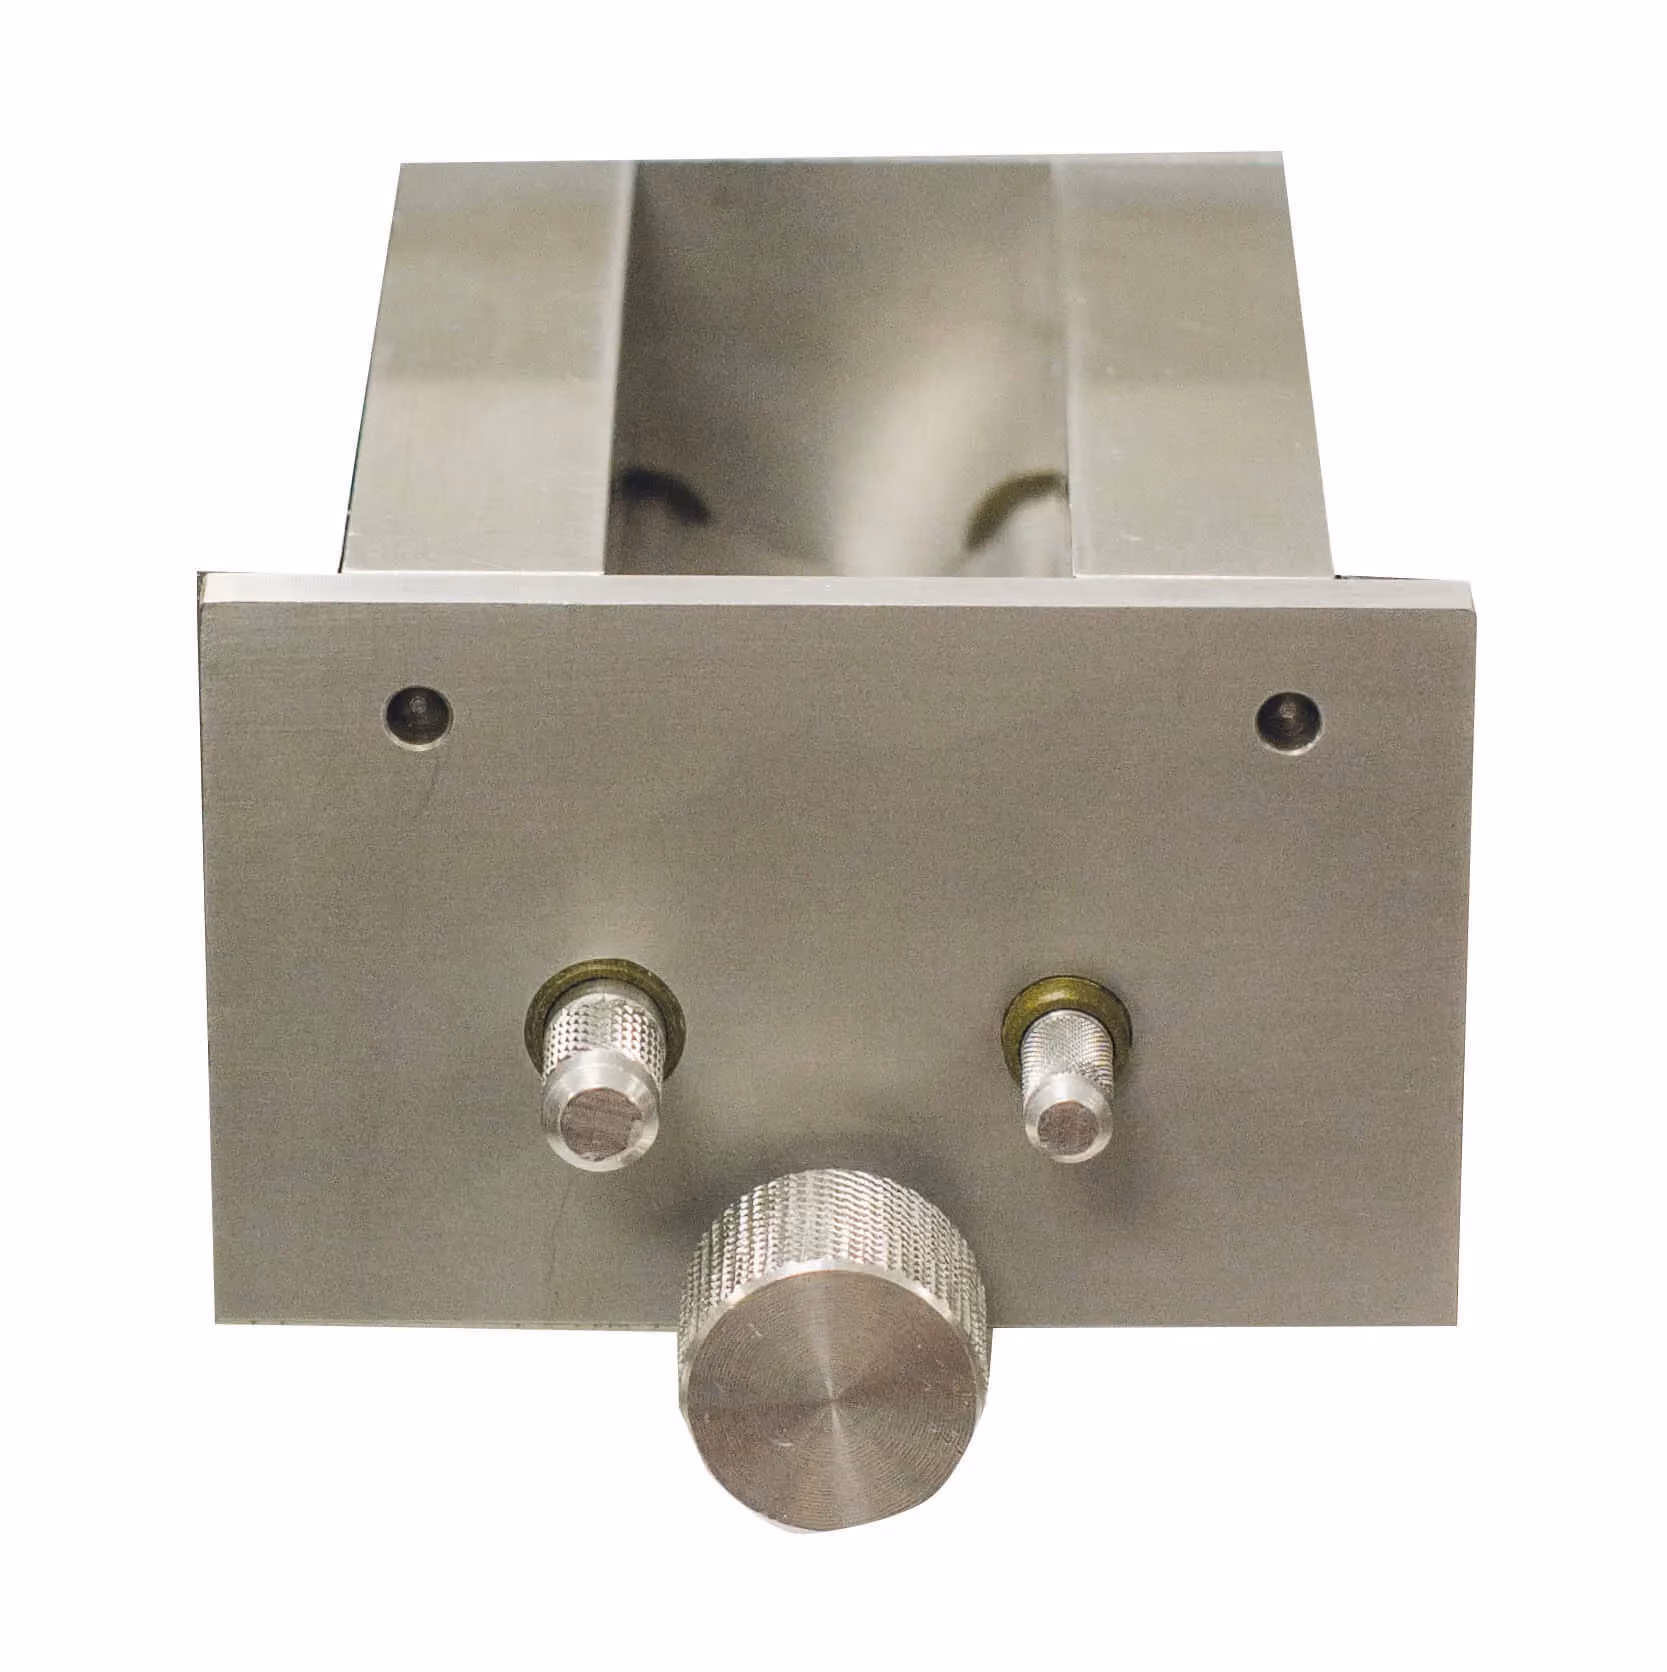
With the Mixolab 300 and its unique dough mixing bowl and dough introduction kit, users have greater capability to analyze doughs of all kinds for their rheological properties. This includes liquid batters, crumbly doughs, sticky doughs, and more.
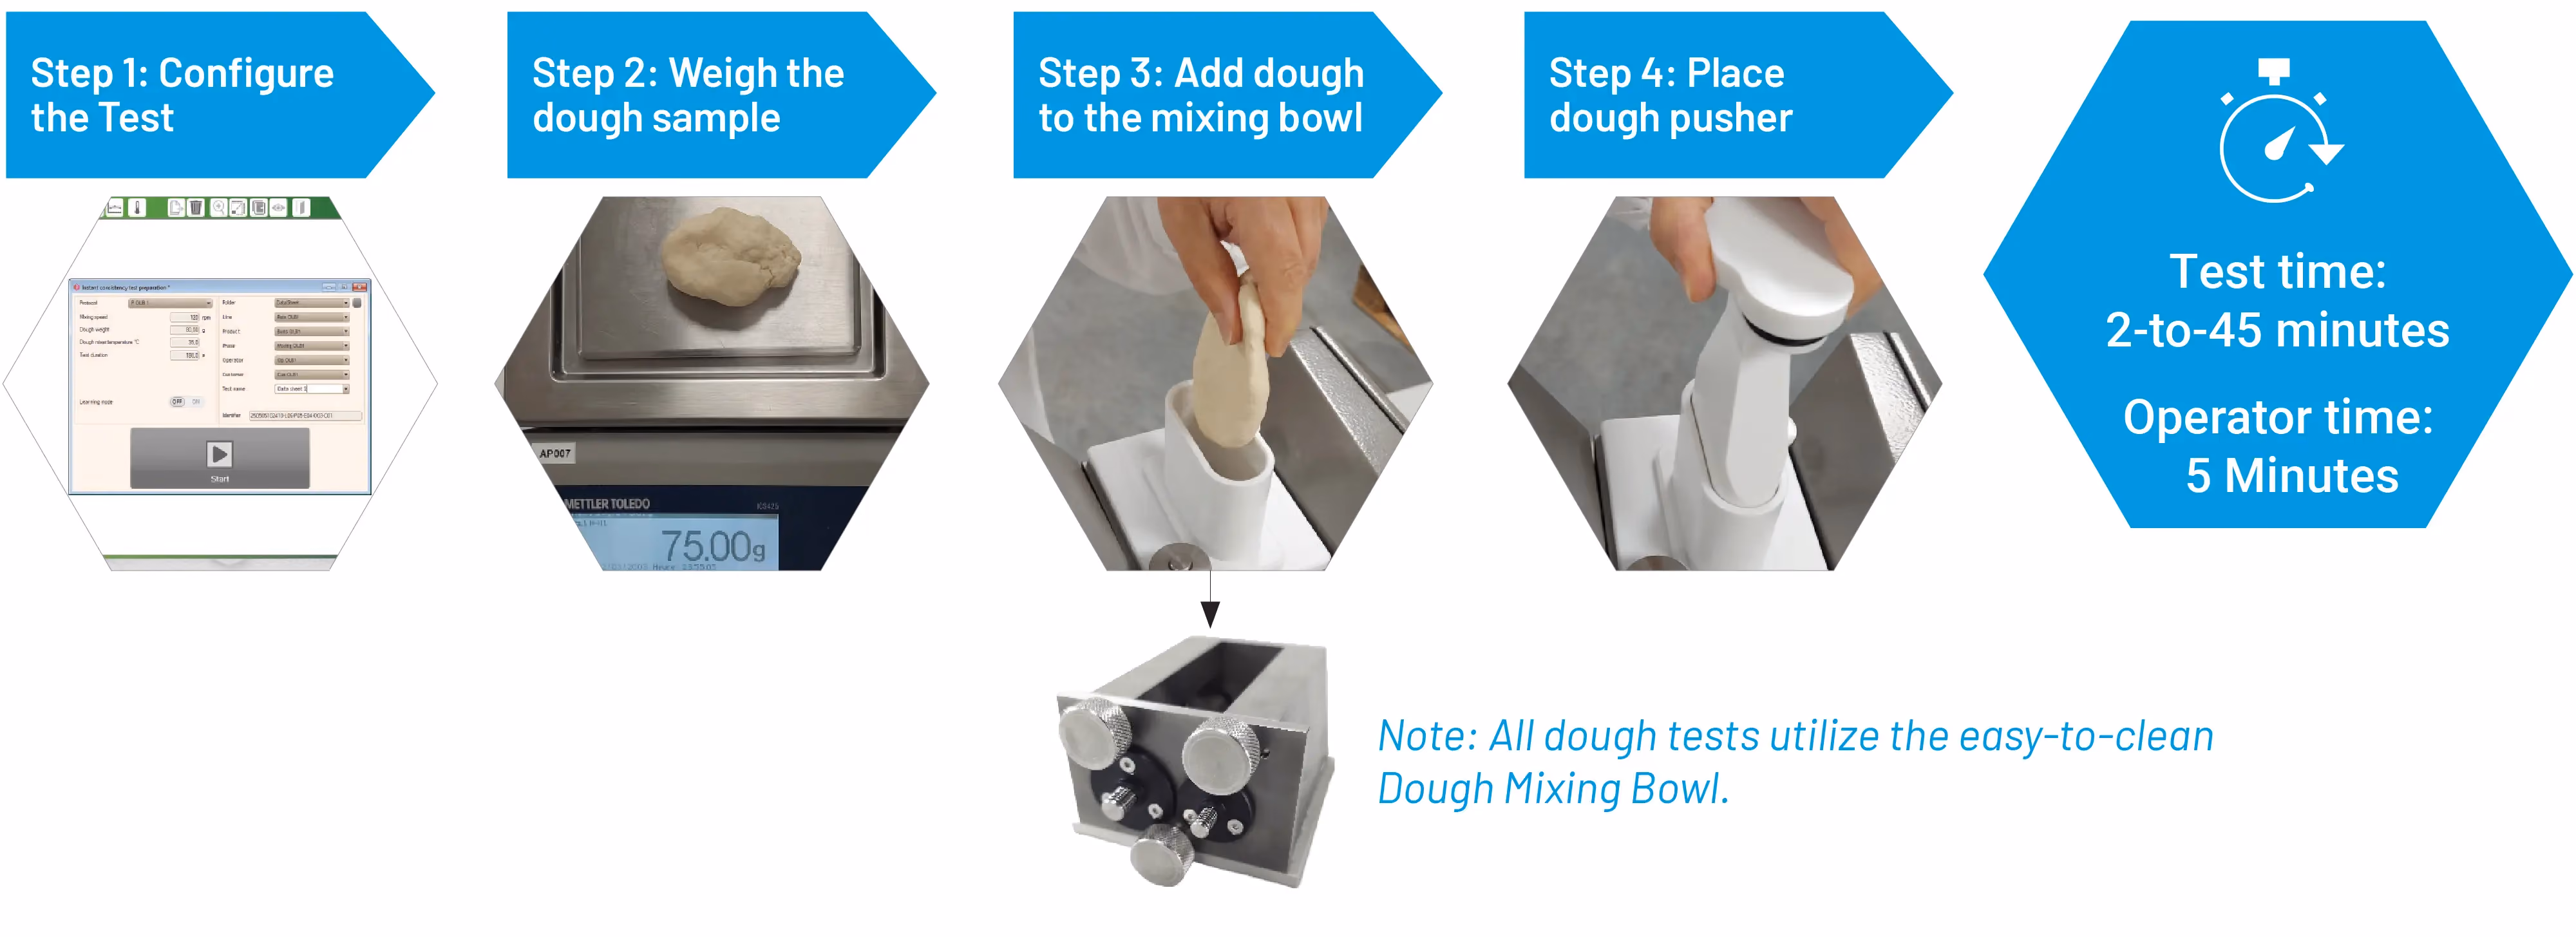
Dough Testing Process (Mixolab 300 Only)
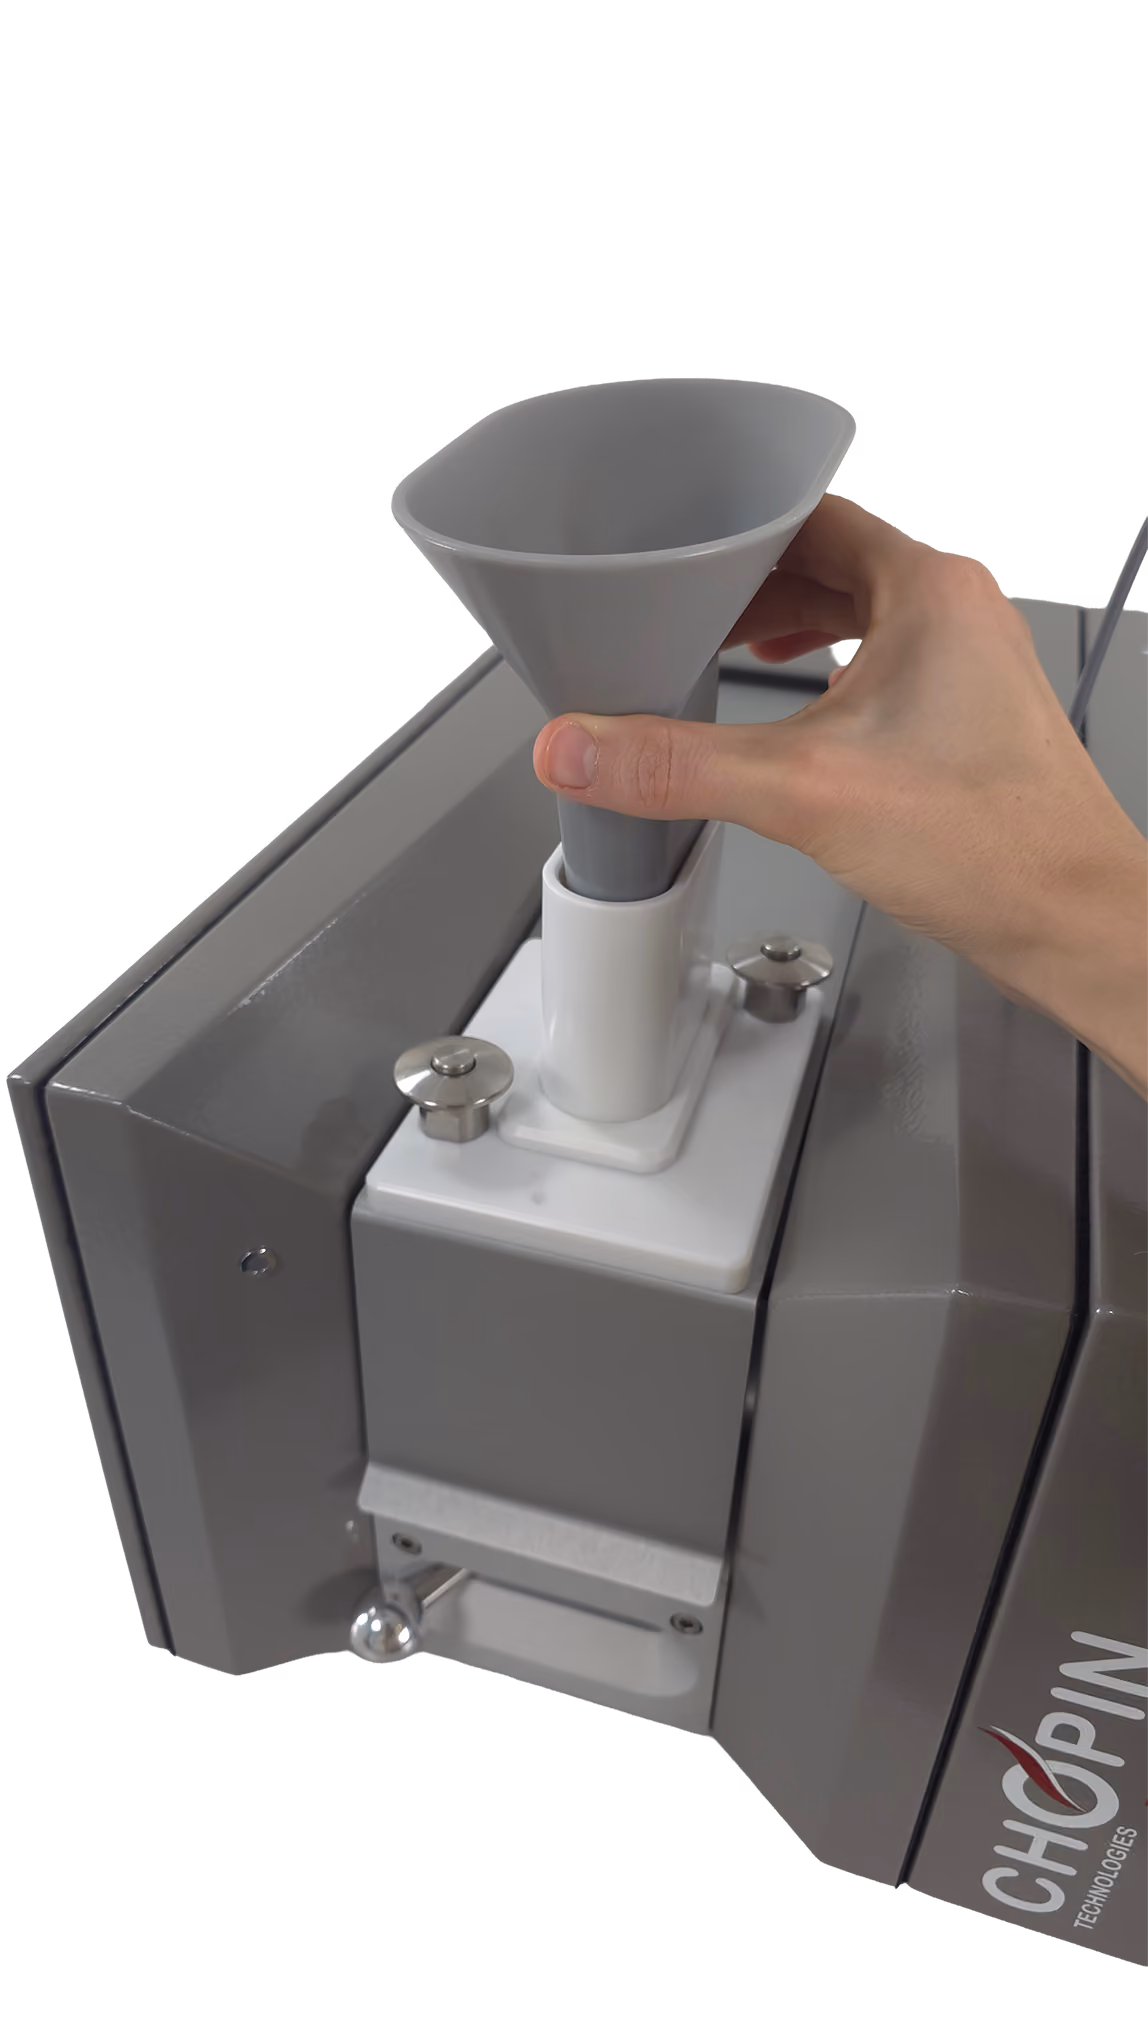
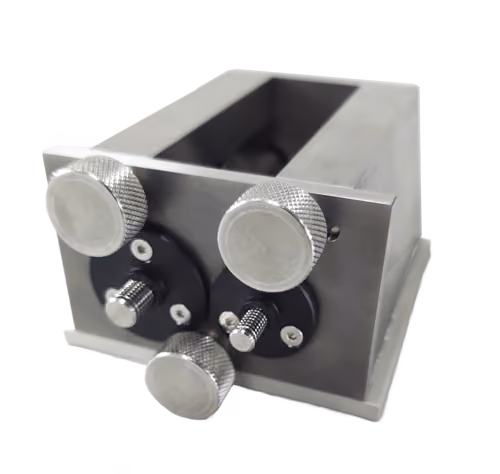
About the Dough Introduction Kit
The Mixolab 300 Introduction Kit provides the tools users need to administer doughs and batters of varying consistency for testing.
Measurements
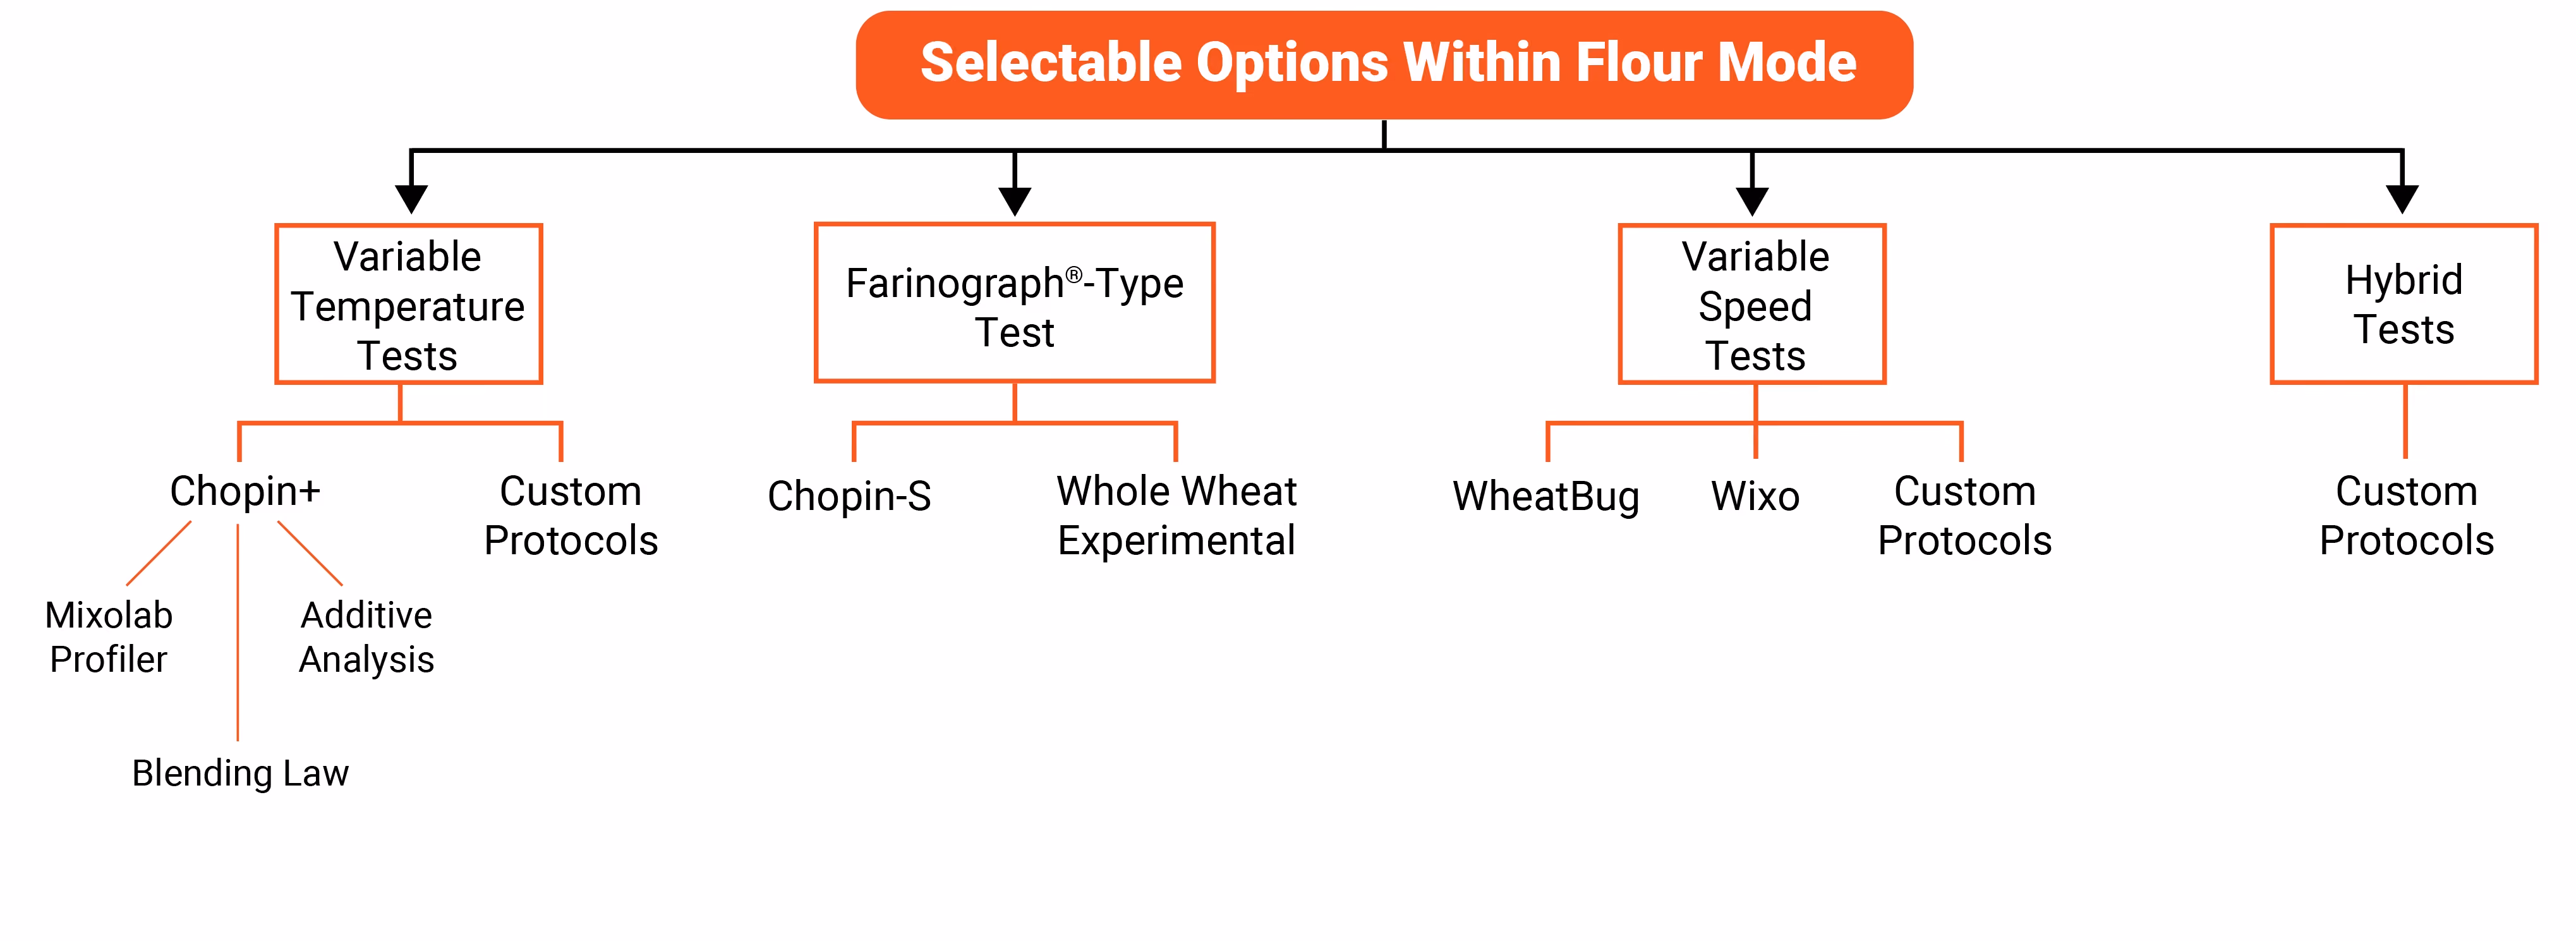
Standard Flour Quality Analysis Protocols (Available for Mixolab 200 and Mixolab 300)
Originally developed for analyzing white wheat flour, the Mixolab Series now offers the most variety of flour and ingredients testing protocols of any instrument of its kind.
Chopin+ Standard Protocol for White Wheat Flour
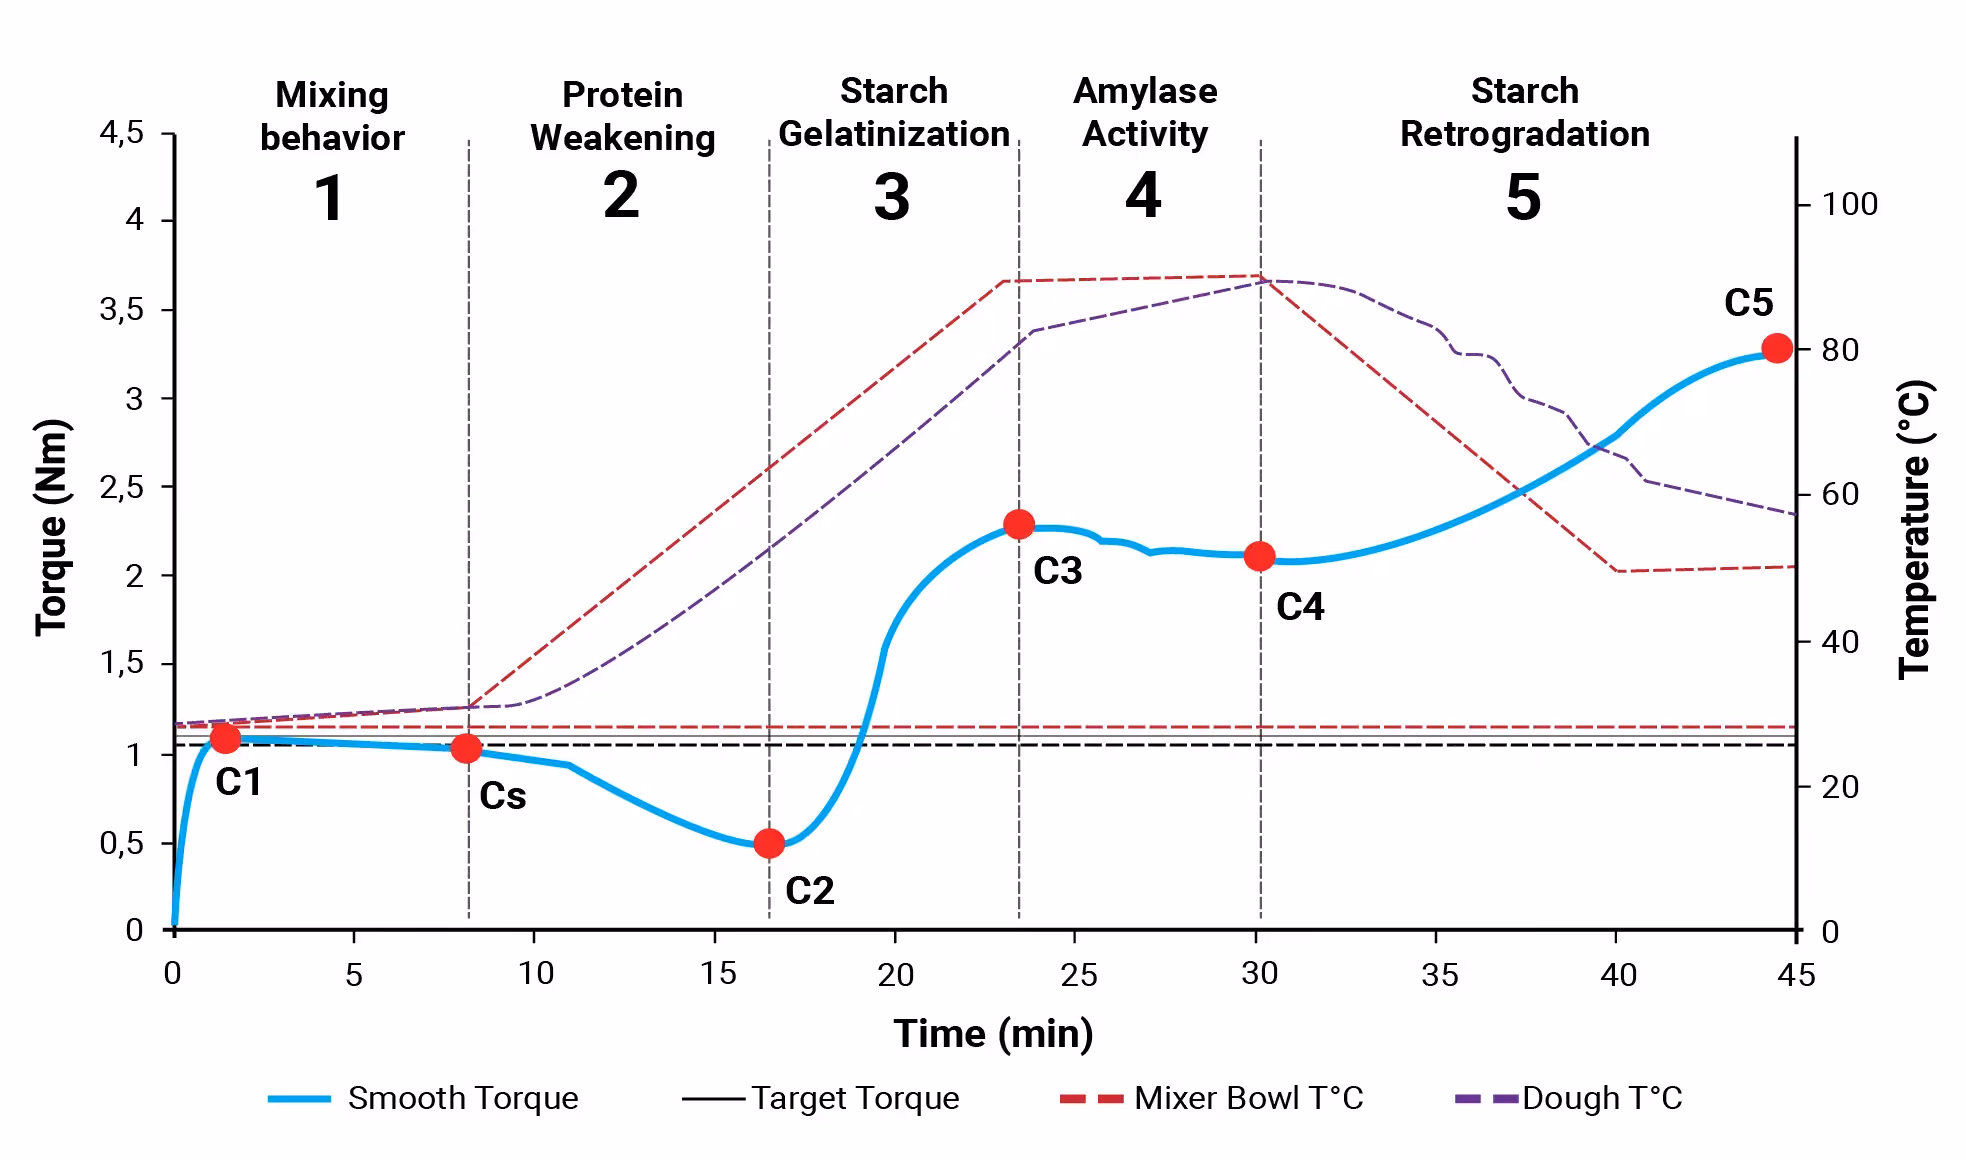
Chopin+ Measurements:
- Mixing Behavior: At constant temperature, the start of the test determines the water absorption capacity of the flours and measures the characteristics of dough during mixing (stability, development time, water absorption).
- Protein Weakening: When dough temperature increases, consistency decreases. The intensity of this decrease depends on protein quality and resistance to temperature.
- Starch Gelatinization: From a certain temperature, the phenomena linked to starch gelatinization becomes dominant and an increase in consistency is then observed. The intensity of this increase depends on the quality of the starch and on the amylase activity.
- Amylasic Activity: The value of consistency at the end of the temperature plateau depends considerably on the endogenous or added amylasic activity. The greater the decrease in consistency, the greater the amylasic activity.
- Starch Retrogradation: As it cools down, starch retrogrades and product consistency increases. This can be related to the shelf life of the product (high retrogradation --> short shelf-life)
Mixolab Profiler: Available for the Chopin+ Protocol
Developed with years of testing with a large database for white wheat flours, the Mixolab Profiler allows products to be classified based on six quality criteria: water absorption, mixing, gluten+, viscosity, amylase, and retrogradation.
It is a perfect tool for quality control of raw materials because you can create specific target profiles, based on finished products quality, to better screen and detect under-performing flours.

Farinograph® Protocol (Chopin-S)
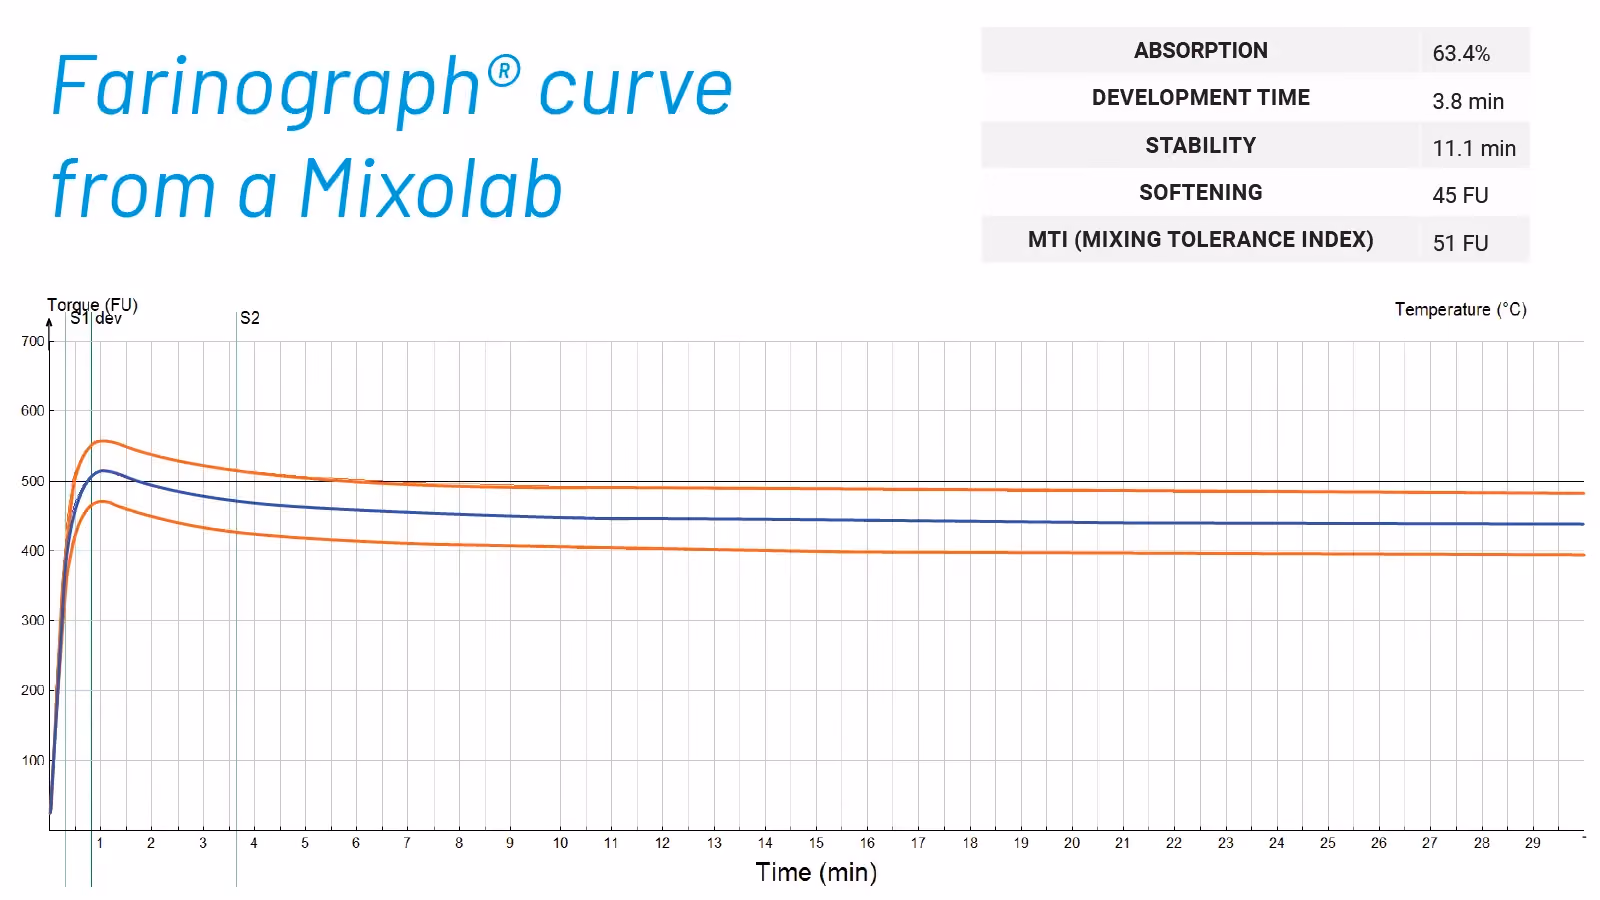
The Mixolab Series is equipped with a test protocol that provides equivalent Farinograph® data (values and units). The data are comparable with those from existing Farinograph® equipment with a much smaller sample size.
Wixo Protocol: Rapid Alveograph Estimation

In eight minutes, with only 50 grams of ground wheat flour, Mixolab Series users can get a rapid and accurate estimation of Alveograph results of wheat at the grain reception using the Wixo protocol. The results were developed with a model using more than 350 wheat samples, produced over three harvest years, all analyzed using the Alveograph reference method (ISO 27971-2023) along with the Wixo protocol.
Other Ready-to-Use Standard Protocols
Create Your Own Custom Flour Protocols
In addition to the ready-to-use protocols, the Mixolab Series offers numerous possibilities for adapting and customizing protocols to respond to most of the new emerging challenges, such as:
- Gluten-free flours
- Starches
- Enzymes
- Pulses
- Vital gluten
- Insect powders, and more
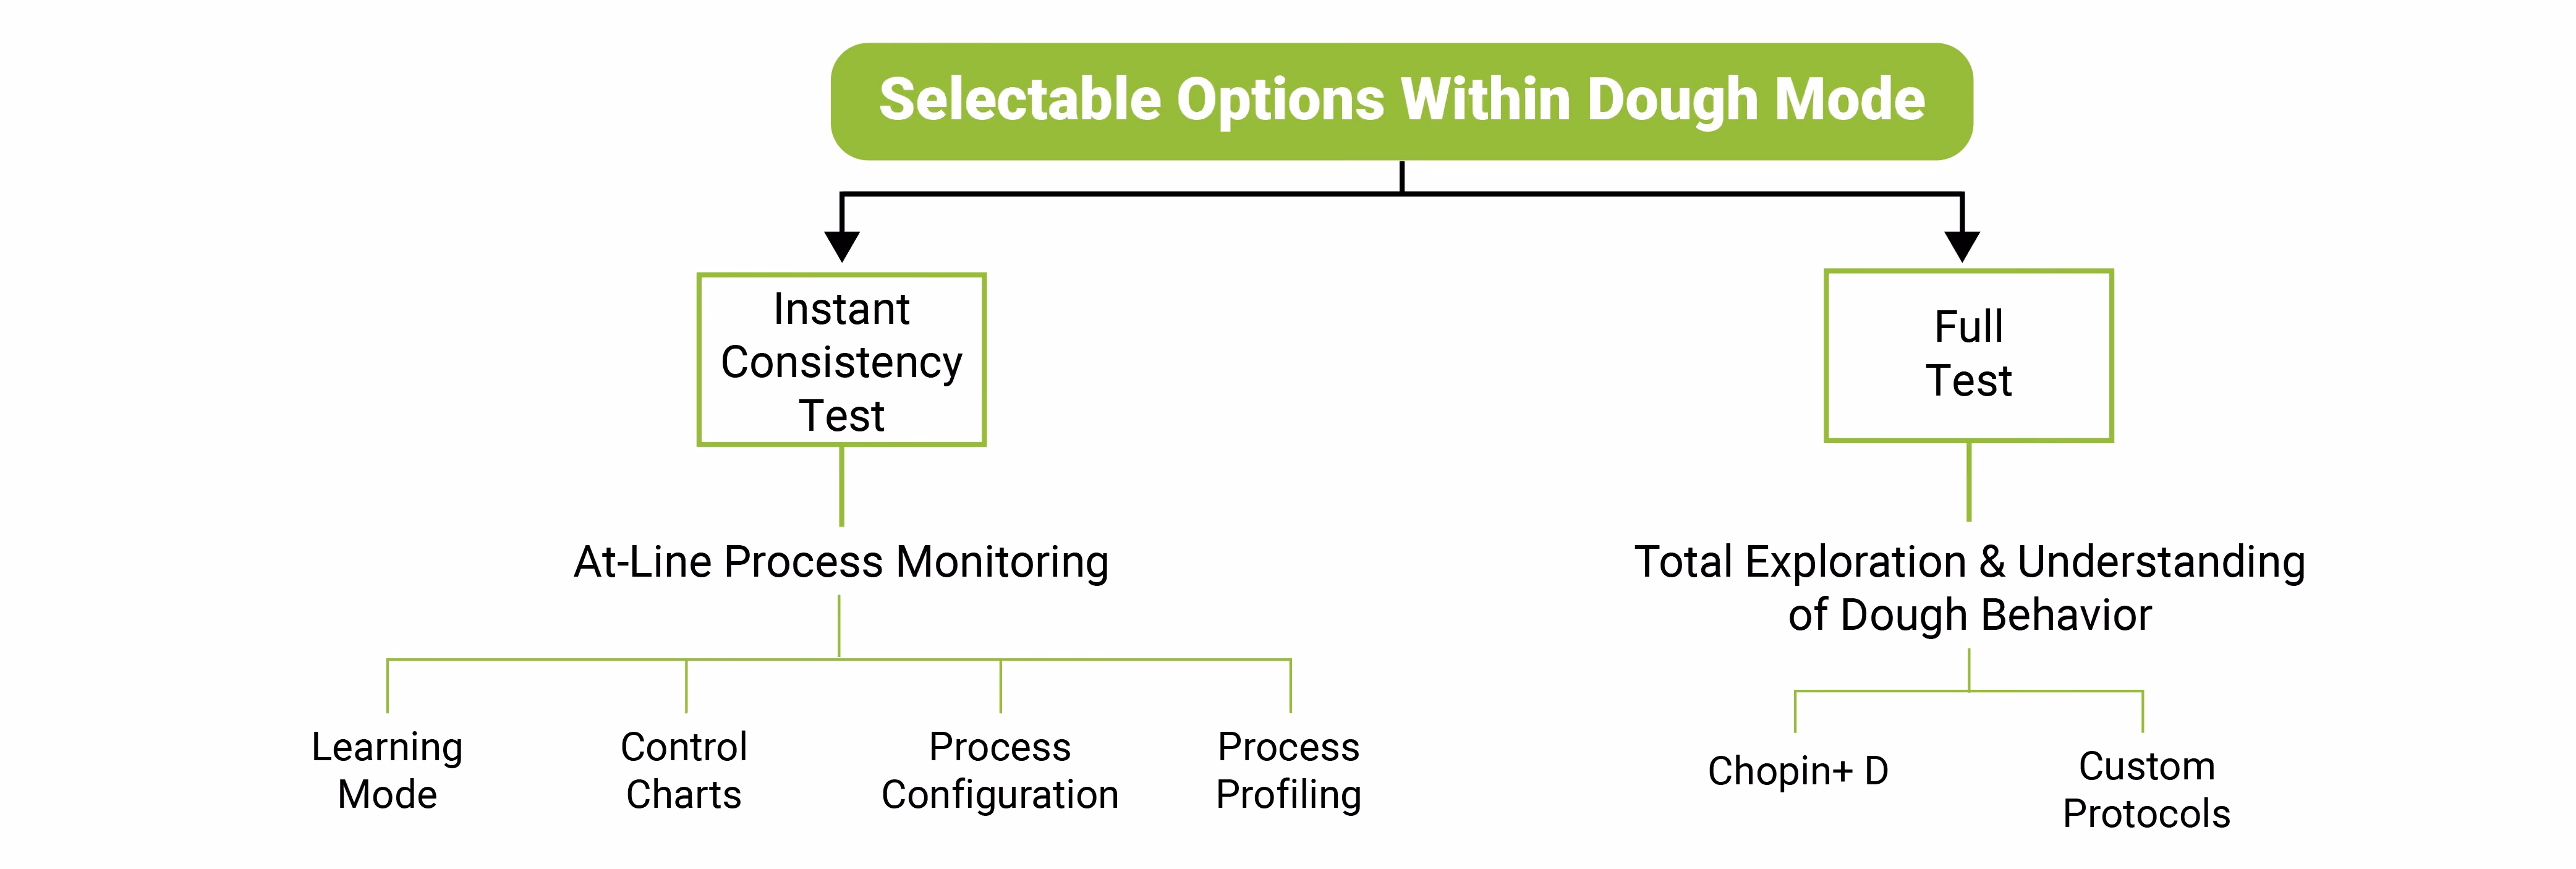
Standard Dough Quality Analysis Protocols (Available Only for Mixolab 300)
The Mixolab 300 is equipped to offer two different dough analysis modes.
Instant Consistency Mode
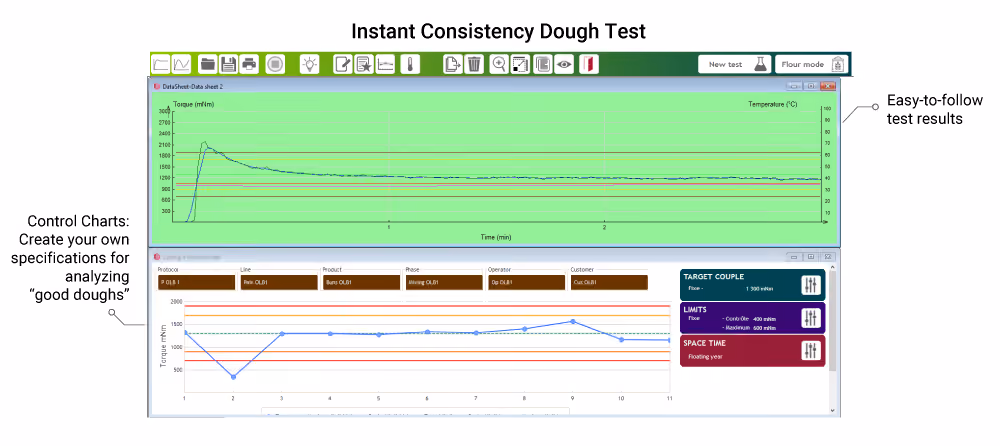
The Instant Consistency Mode is ideal for at-line dough sampling off of a baking production line. The system generates an objective reading of dough consistency in as little as two minutes, helping operators make faster, better-informed process decisions.
Additionally, the Instant Consistency Mode includes a “Learning Mode” module for creating custom dough protocols.
Full Test Mode
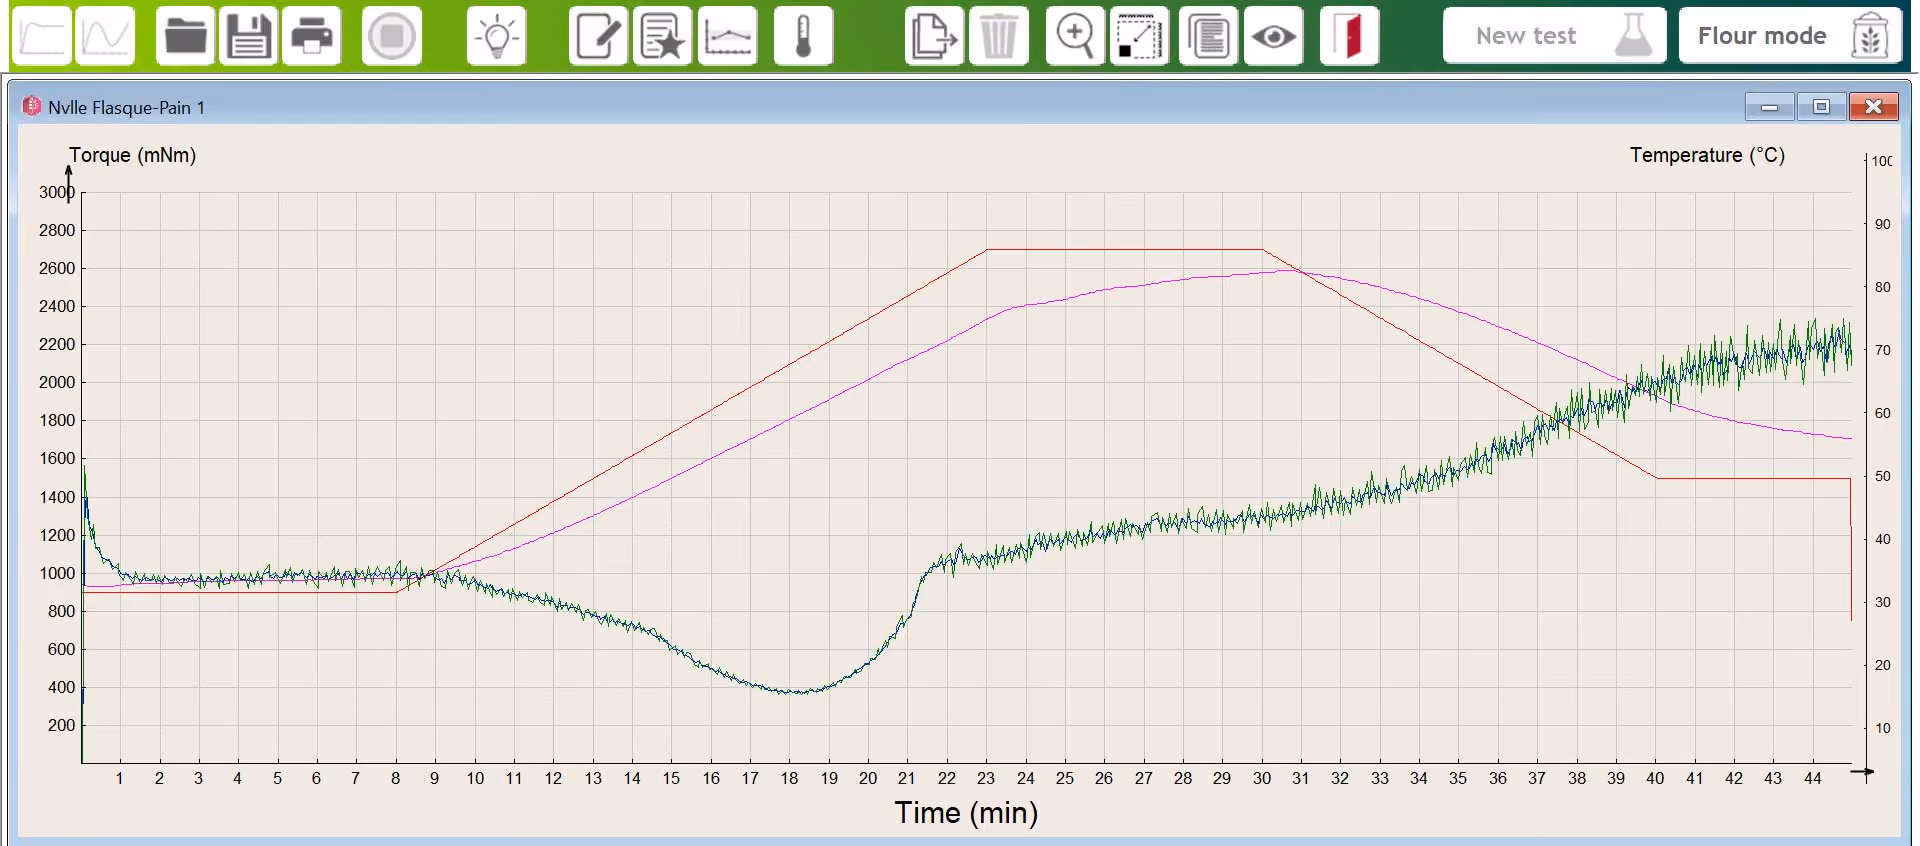
Ideal for R&D and product development, the Dough Full Test Mode provides a complete view of dough behavior during mixing, heating, and cooling phases.
Create Your Own Custom Dough Protocols
In addition to the ready-to-use protocols, the Mixolab Series offers numerous possibilities for adapting and customizing protocols to respond to most of the new emerging challenges, such as:
- Gluten-free flours
- Starches
- Enzymes
- Pulses
- Vital gluten
- Insect powders, and more
Software
The MixoPRO software with the Mixolab Series is a comprehensive package with advanced features to help users gain valuable insights on their flour and dough products, requiring little training or operator expertise.
The MixoPRO software with the Mixolab Series is a comprehensive package with advanced features to help users gain valuable insights on their flour and dough products, requiring little training or operator expertise.
Universal Software Features (Both Flour & Dough Modes)
- Available in 17 languages.
- Instructional videos included for easy training and handling.
- Select from various test units (Nm / mNm / °C / °F).
- Compare multiple trials and adapt curve color and thickness for better visibility.
- Export tests in multiple file formats, making it easy to connect to LIMS (.xlsx, .csv, .wdz).
Flour Mode
The MixoPRO Flour Mode provides the complete range of flour analysis for various protocols and custom tests.
Flour Mode
The MixoPRO Flour Mode provides the complete range of flour analysis for various protocols and custom tests.
Dough Mode
The MixoPRO Dough Mode revolutionizes at-line dough testing, allowing users to quantify dough attributes quickly and simply.
Dough Mode
The MixoPRO Dough Mode revolutionizes at-line dough testing, allowing users to quantify dough attributes quickly and simply.
Accessories
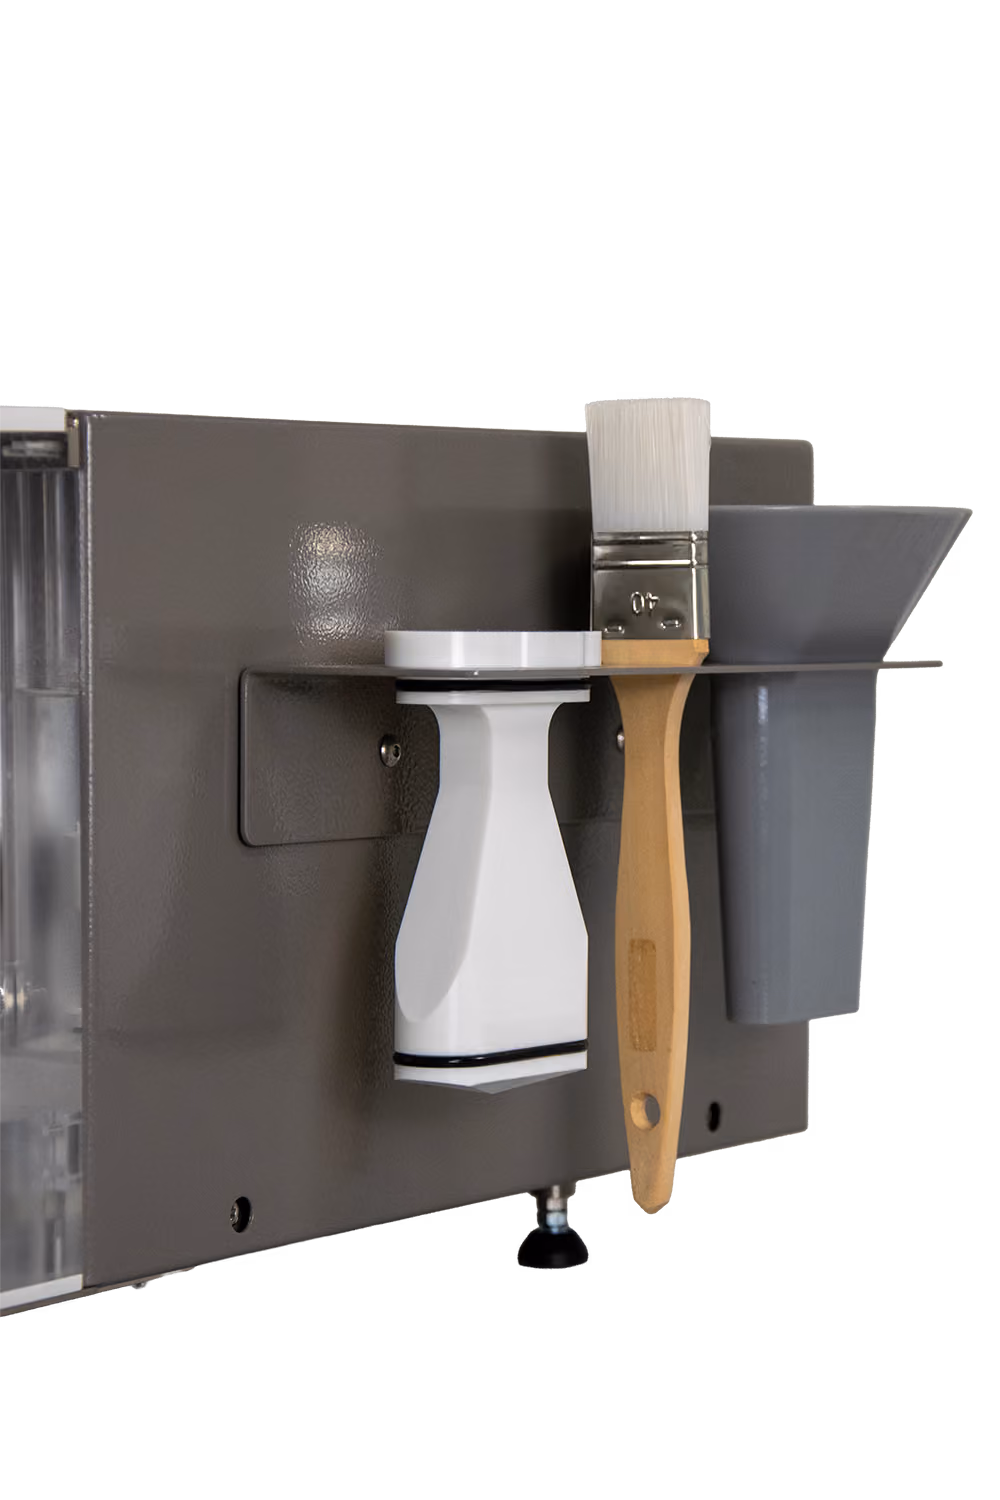
Accessories for the Mixolab 200 & 300
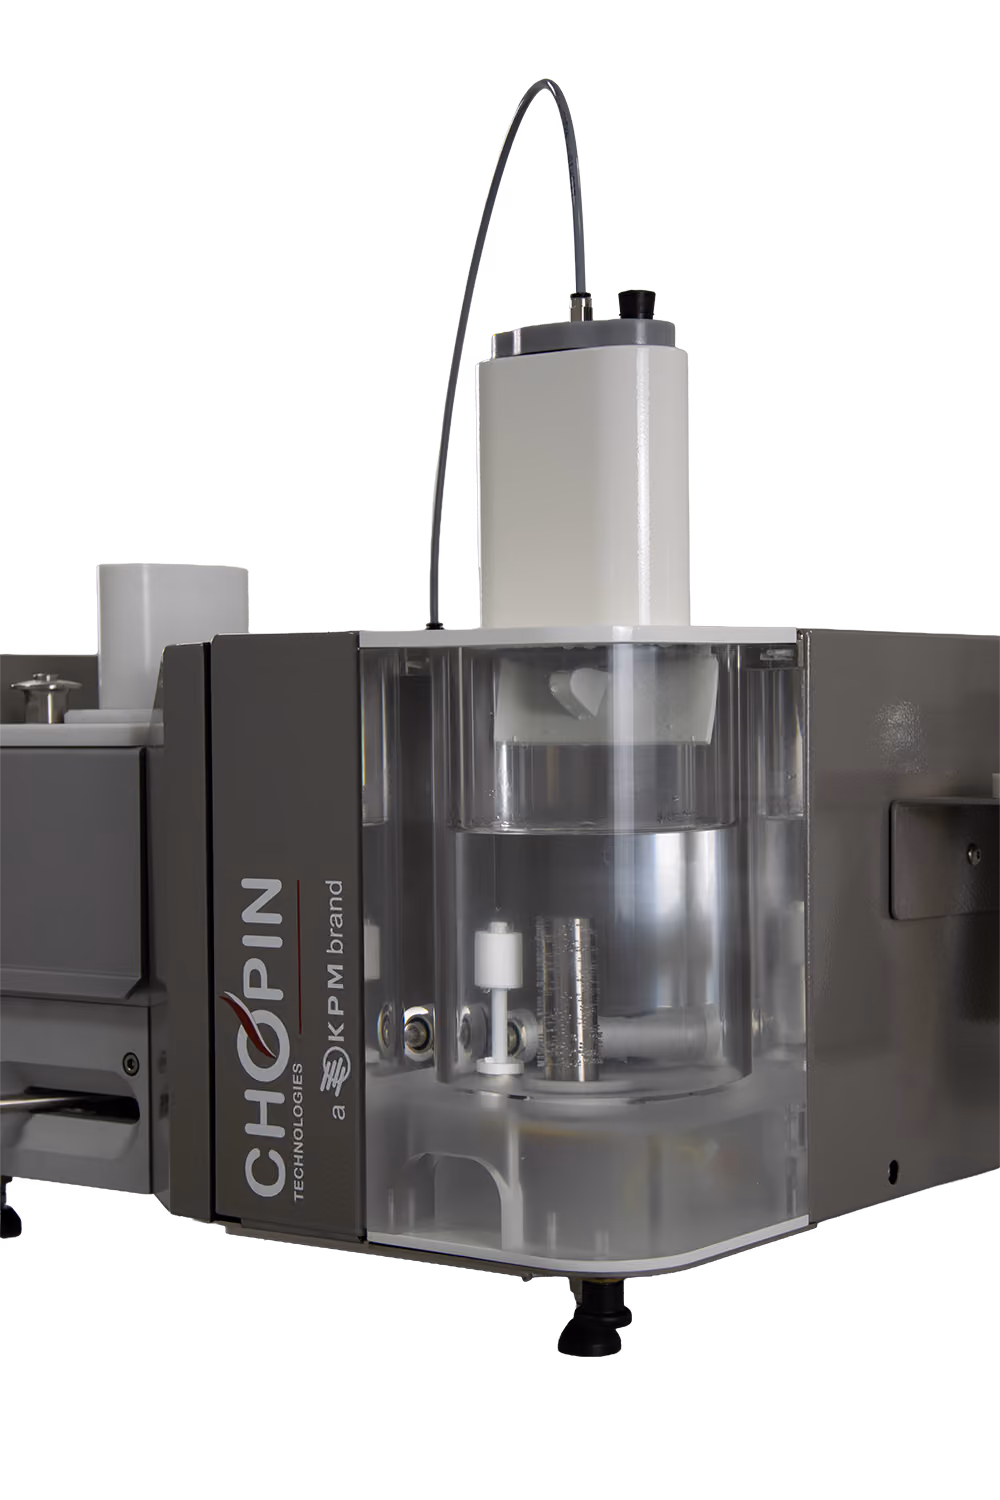
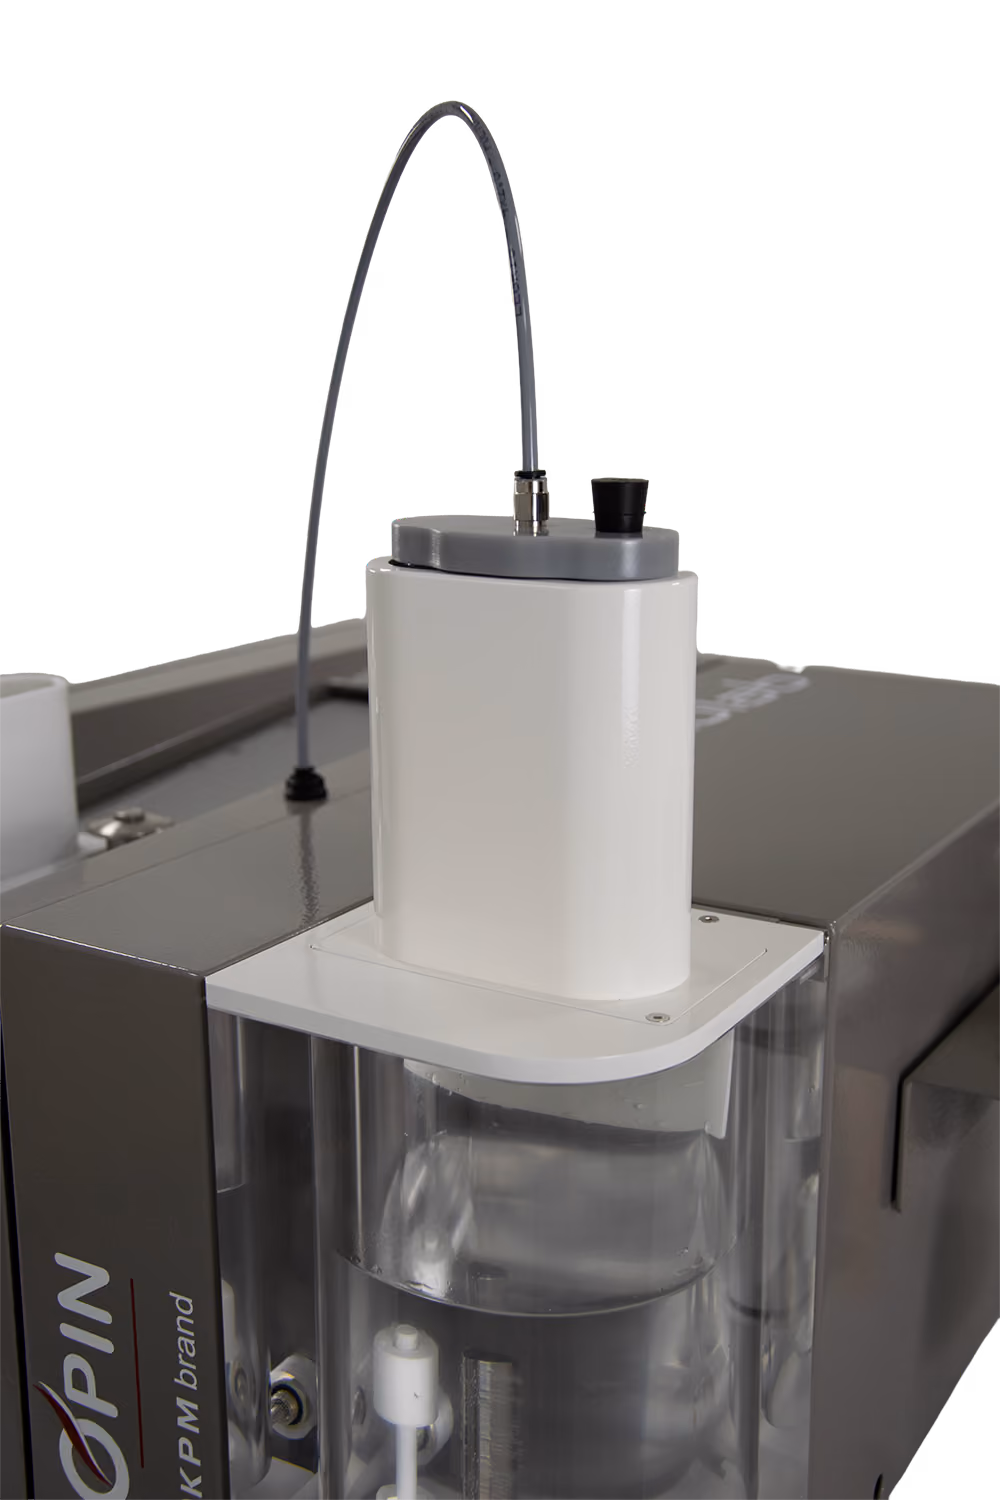
The Mixolab Series comes complete with a kneading machine with accurate temperature control, and an integrated water tank. The system also includes a MiniPC (not furnished: keyboard, monitor, monitor connector cable, mouse). Necessary hydraulic hoses to connect Mixolab to the cold water supply is included, as well as a cleaning brush, a filling hopper and additional spare parts. The cooling system is not furnished.
- Additional Flour or Dough mixing bowls available
- Flour reference samples for Flour or Dough mixing bowls
- Spare parts kits
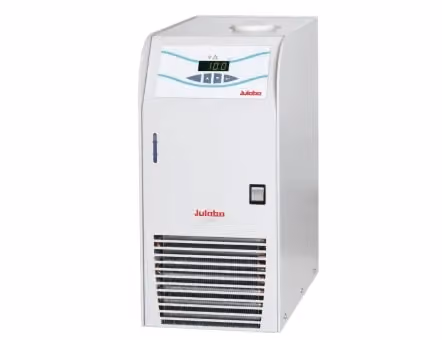
- Recirculating chillers (250W and 500W)
Specifications
Frequently Asked Questions
Yes, the Mixolab has been equipped with the Simulator feature, which allows you to obtain data at all points equivalent (values and units) to the Farinograph®. This allows you to compare the data with partners or to have a first assessment of the wheat quality with a small sample size.
Resources