
.webp)
FAQs
Application
Analysis of Confectionery Products

Quality Control Methods for Confectionery Producers
How sweet it is to be a candy maker – you certainly will have friends everywhere you go! Around the world we have different names for the delicacies in this category including candy, sweets, chocolates, dodol, sweetbreads, sweetmeats, candy bars, bonbons, caramels, mithai, etc. In general, confections fall into 3 categories: sugar confections, flour confections, and chocolate confections.

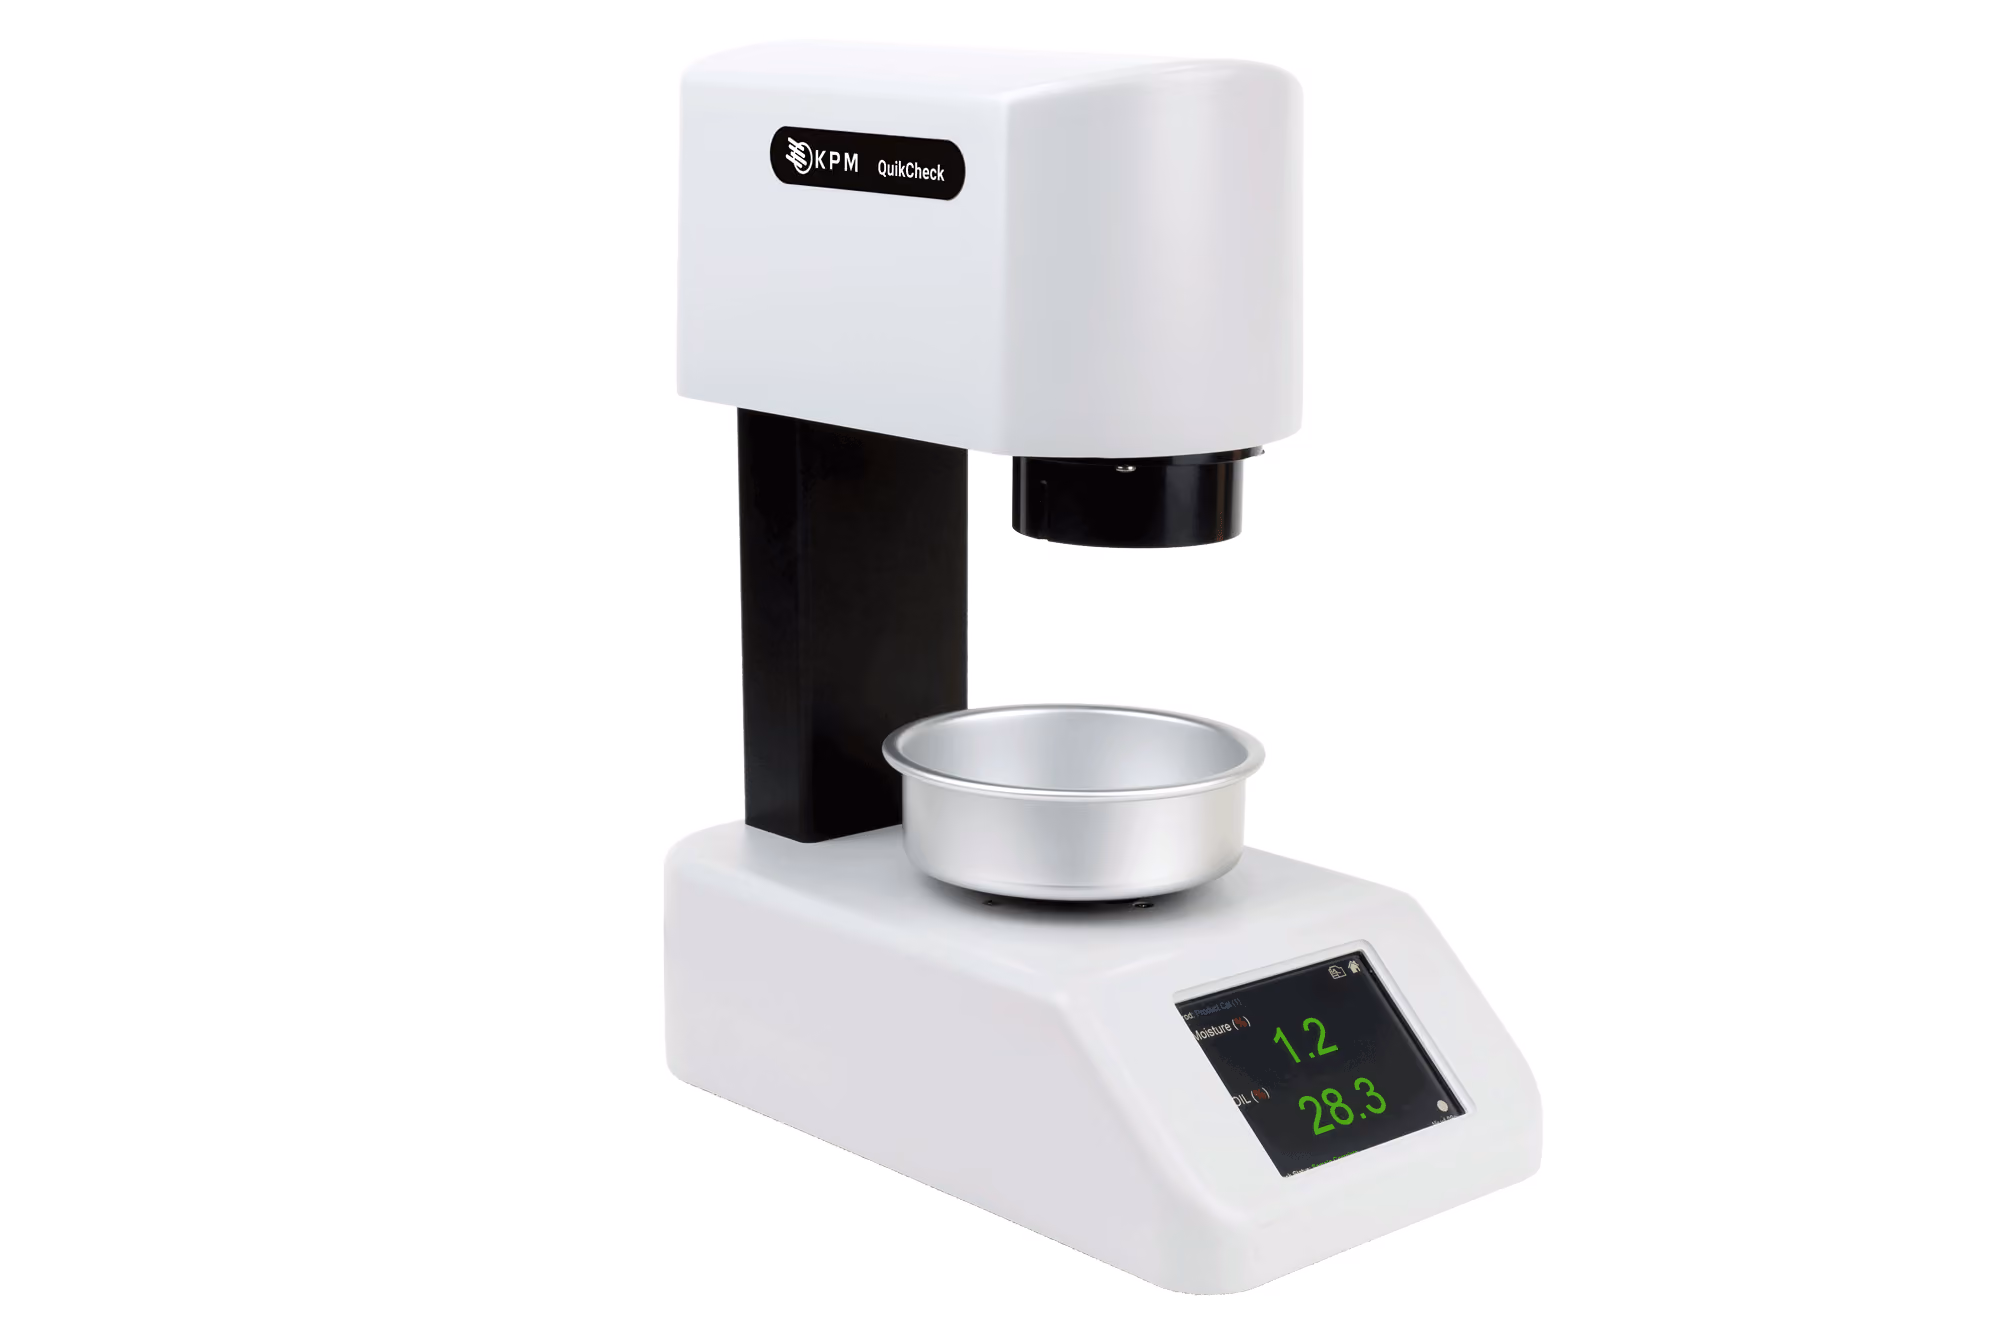
Moisture & Compositional Analysis of Confectionery Ingredients
NIR analysis can be an essential tool for commercial confectionery makers. NIR analysis enables rapid, non-destructive measurement of constituents in confectionery ingredients. This provides several benefits for the industry, including reduced costs, improved product quality, and increased efficiency. Additionally, it allows manufacturers to ensure their products meet regulatory standards, as well as providing a tool for the development of new products with enhanced functionality.
What's Measured
What's Measured
Cocoa Powder
Analysis Benefits:
Quality control and to avoid production challenges
Constituent Measured:
Moisture, fat
Point of Analysis:
Incoming ingredients, cocoa processing, chocolate making, final product before packaging
Types:
All types
Dry Sweeteners
Analysis Benefits:
Specification compliance, quality control, cost control, recipe development, brand protection
Constituent Measured:
Moisture
Point of Analysis:
Supplier's location, incoming ingredients, lab
Types:
Cane sugars, refined white sugars, brown sugars, VHP sugar, beet sugar, aspartame, sucralose, stevia, saccharin, cyclamate, sweetener mixtures
Flour
Analysis Benefits:
Specification compliance, quality control, cost control, recipe development, brand protection
Constituent Measured:
Ash, gluten, moisture, starch, protein
Point of Analysis:
Supplier's location, incoming ingredients, lab
Types:
Wheat flours, corn flour, spelt flour, buckwheat flour, rice flour, rye flour, gluten-free flours
Fat/Oil
Analysis Benefits:
Specification compliance, quality control, cost control, recipe development, brand protection
Constituent Measured:
Fat/oil
Point of Analysis:
Supplier's location, incoming ingredients, lab, online
Types:
All types
Finished Product - Baked Goods
Analysis Benefits:
Specification compliance, quality control, cost control, recipe development, brand protection
Constituent Measured:
Moisture
Point of Analysis:
At-line, lab, Online
Types:

KPM Products
NIR Solutions for Confectionery Ingredient Analysis

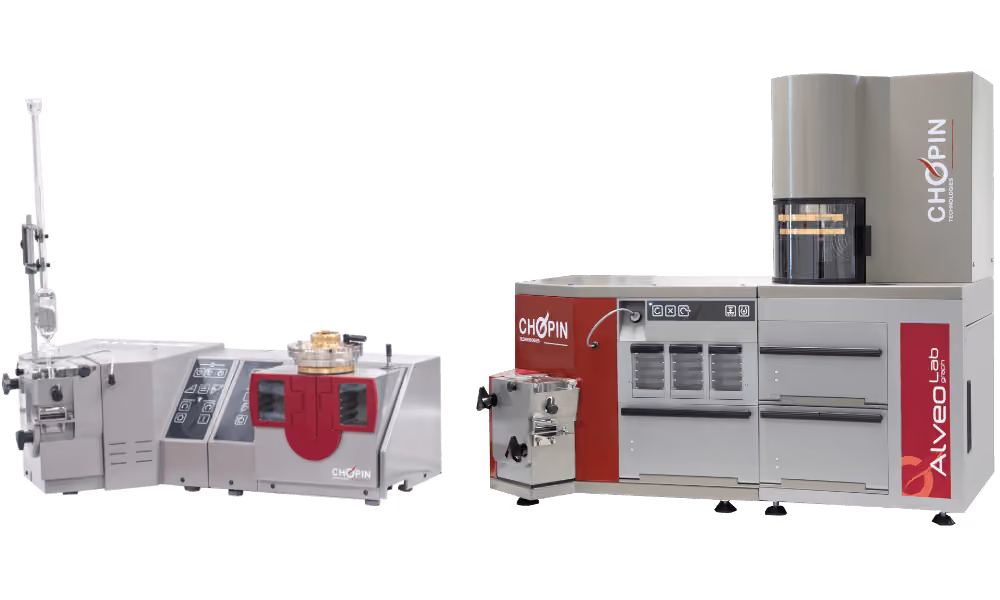
Flour, Dough, & Batter Analysis
Achieving consistent quality in your products is essential to maintaining your brand's reputation and satisfying your customers' expectations. Starting with the best ingredients leads to success at each stage of production. KPM offers advanced tools to accurately measure the properties of flour and the characteristics of doughs and batters allowing you to adjust your recipe and processing methods as needed to achieve the desired results every time.
Water Absorption
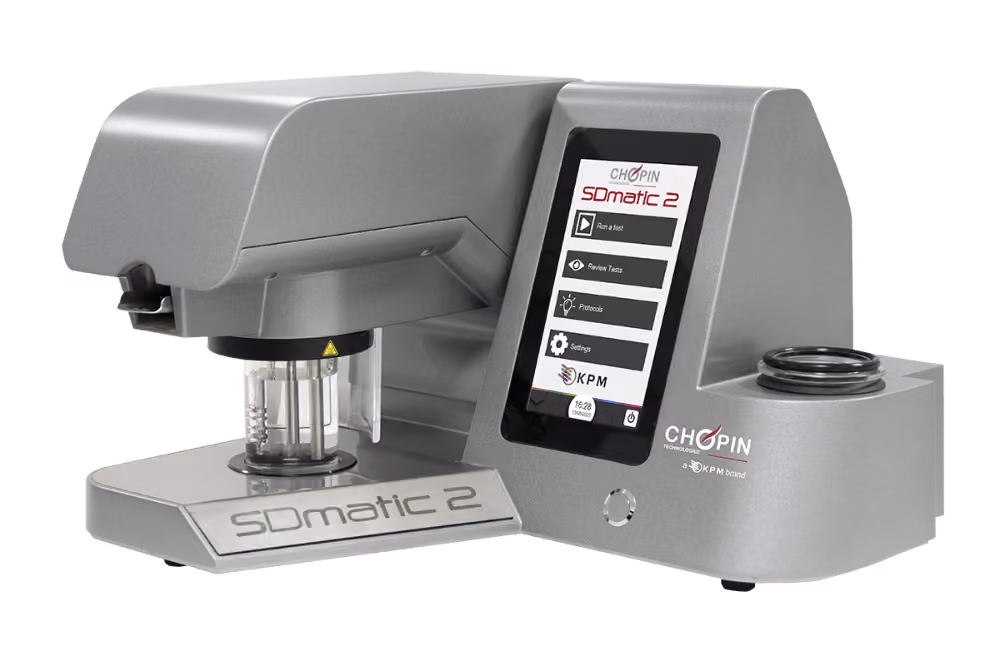
For wafers, as an example, the formed dough (batter) is liquid and the required level of hydration is high (100-150%). The amount of water that any flour can absorb increases with high levels of protein, damaged starch (particle size) or pentosans. These flour characteristics are particularly important in the manufacture of products such as wafers, ice cream cones, or waffles because, as the water content of the finished products is very low (<2%), most of the water absorbed in the mixing process must be evaporated during the baking, an expensive process. It is very simple to measure water absorption directly using the Mixolab and the Alveolab or AlveoPC. A good estimate can be obtained by measuring starch damage (SDmatic 2) and protein levels (NIR).
Stickiness
Important for other doughs that require average levels of hydration. This often occurs when starch damage or pentosan levels are too high and the protein levels are too low. Sticky dough causes process machine problems when dividing and pressing tortillas. Measure starch with the SDmatic 2, and protein levels with the SpectraStar XT-F NIR Analyzer.
Dough Consistency & Viscosity
Dough consistency depends on the amount of water added and the ability of the flour to absorb this water. For any given level of hydration, the consistency of the dough represents its tenacity, its hardness. This depends, on the quantity and quality of the proteins, the starch damage, and the pentosans. Mixing consistency may be measured by either the Mixolab or, after rolling by the Alveolab or AlveoPC. It is also possible to individually measure the factors responsible for consistency: proteins (NIR,damaged starch (SDmatic 2).
Process of Baking and Evaporation of Water
Again, using wafers as an example, the baking process is very fast (about 2 min at 180 ° C). During baking, the majority of the water contained in the liquid dough must be evaporated. The main molecules present in the flour (proteins, starch, pentosans) create more or less strong bonds with the water molecules. The stronger these links are, the more energy is needed to break them (during baking). The greater the strengths of these bonds, the more expensive the manufacturing process. Flours with weak proteins (NIR or Alveolab) will be favored for the manufacture of wafers. Similarly, low starch damage (SDmatic 2) flours will be chosen because higher damage results in greater gelatinization (Mixolab) of the starch during cooking and higher water absorption.
Retrogradation
After baking, the starch will tend to partially recrystallize. This phenomenon is called retrogradation and explains why the products become hard (stale). The beginning of retrogradation is very easily measured with the Mixolab. Damaged starch has the effect of reducing the speed of retrogradation, it is measured with the SDmatic 2.
KPM Products
Functional & Rheological Tools for Confectionery Makers

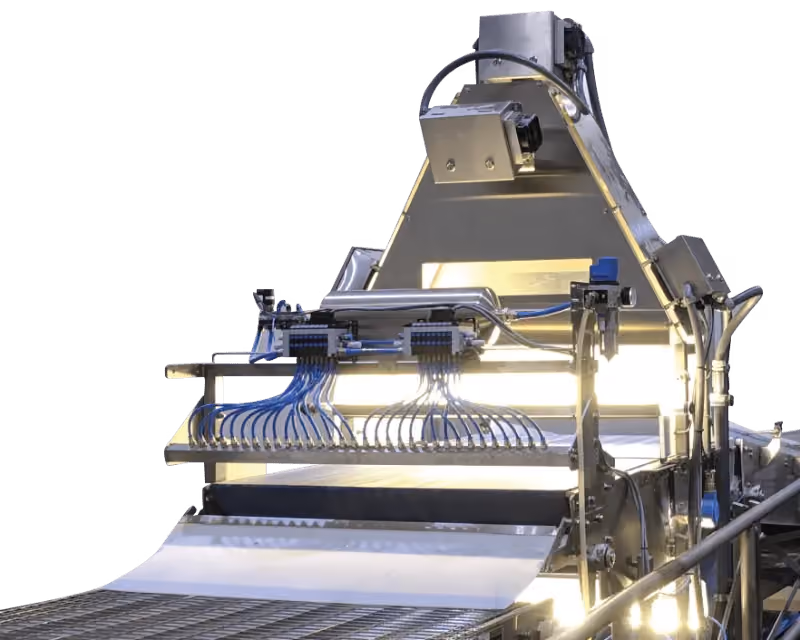
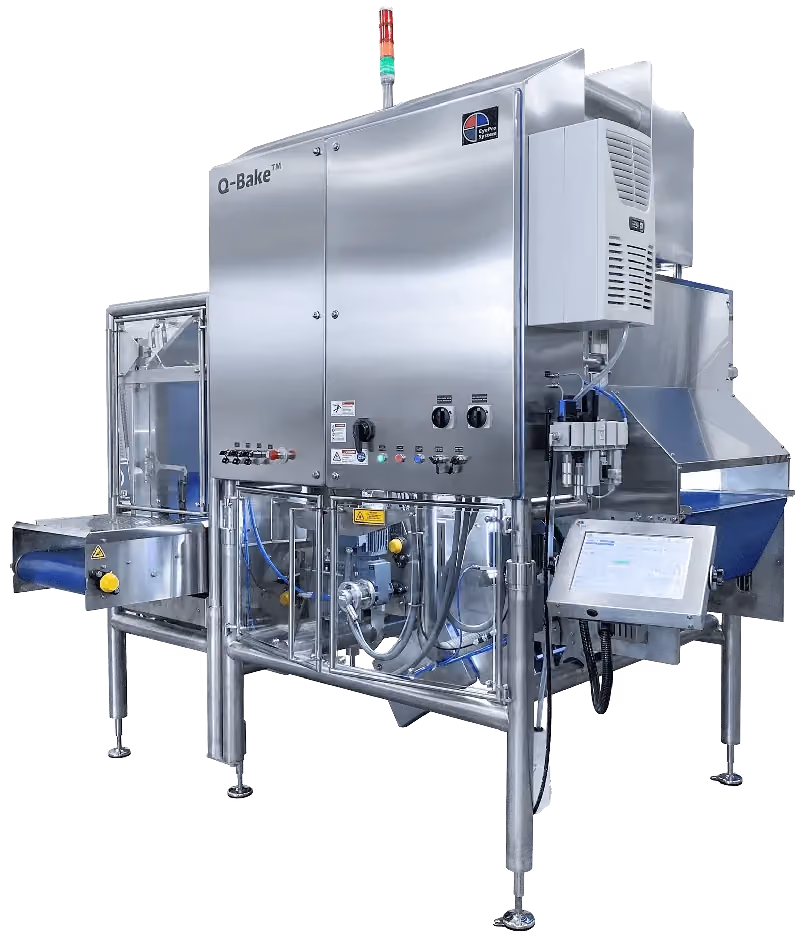
Vision Inspection for Confectionery Products
Our advanced vision inspection systems are specifically designed to perform quality checks at full line speed and assist with process control of food products. When it comes to confectionery items, there are countless possibilities for shapes, sizes, colors, and textures. Our systems are highly versatile, can be customized for a variety of products, and can be deployed at multiple points in the line.
Product Types
Vision inspection of chocolates is typically performed after molding and before packaging. Doughnuts can be inspected after proofing, drying, and glazing/topping.
Chocolates
- Any shape or size
- Any color (dark, white, milk, multi, specialty)
- Solid, hollow or filled
- Novelty chocolates
Donuts
- Any shape or size
- Glazed, iced, and with any combination of toppings
- Specialty
Chewing Gum
- Tabs, sticks

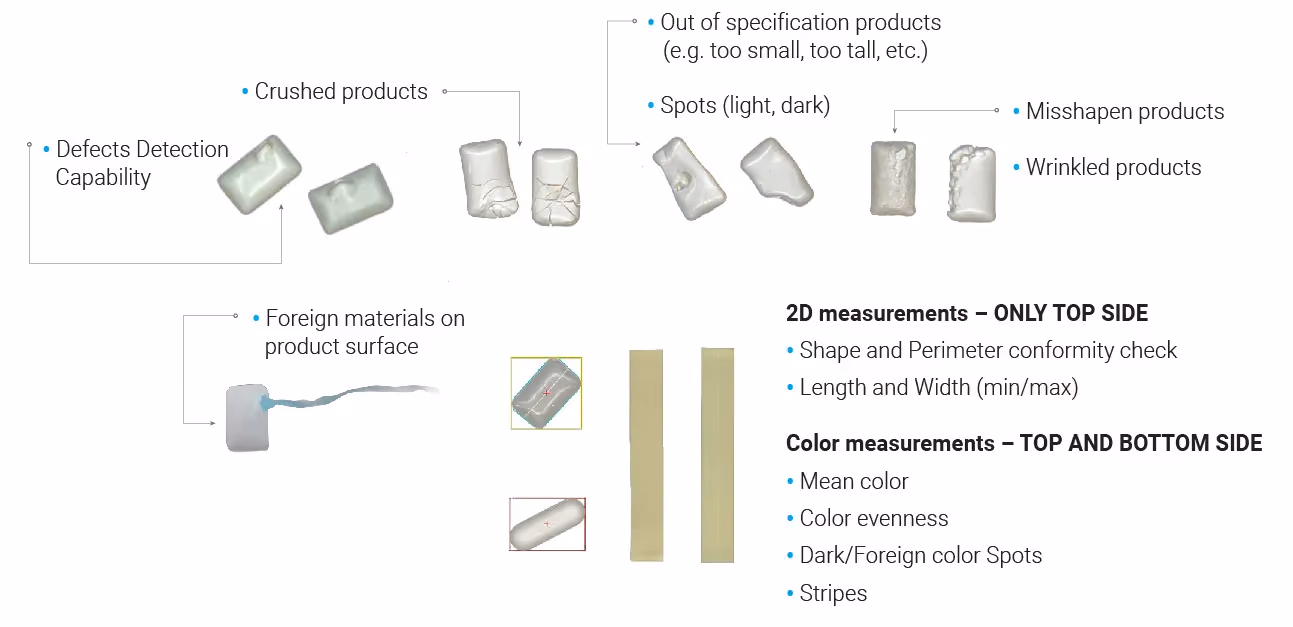
Measurement Capability
- 2D Shape & Size - min/max/mean length, width, & diameters, roundness/ovality, patterns
- 3D/Height - peak height, volume, slope, predicted weight, surface texture
- Top Color - avg color with topping and hole areas ignored (e.g. donuts)
- Bottom Color - average color
- Donut Hole Conformity - hole area, min/max/mean hole diameter
- Toppings - % coverage, distribution, voids
Many customized measurements are available. Contact us to discuss your specific needs.
Defects Detection Capability
- Irregular shapes or sizes, hole size too big or too small
- Color issues (dark/light spots, wrong color, etc.)
- Topping voids or uneven distribution
- Missing branding marks or patterns
- Crushed gum tabs
- Foreign material
- Wrinkled gum

No items found.
Resource Center